
Devops-Proj-4 : End-to-End DevSecOps Kubernetes Project using AWS, Jenkins CICD Pipeline
Overview and Workflow of the Project:
- AWS Cloud: The project is hosted on AWS infrastructure.
- EC2 Instance: An Ubuntu 22.04 T2 Large instance is used as the main server.
- Tools on EC2:
- Jenkins: For continuous integration and deployment
- Docker: For containerization
- Trivy: For container vulnerability scanning
- Prometheus & Node Exporter: For monitoring
- Jenkins Plugins: Various plugins are installed, including Node.js, SonarQube, email integration, Kubernetes plugin, and OWASP for security checks.
- Jenkins Pipeline: A CI/CD pipeline is set up in Jenkins, which includes:
- Source code management (likely using GitHub)
- SonarQube for code quality analysis
- OWASP dependency check for security vulnerabilities
- Trivy for container scanning
- Docker image building and pushing to Docker Hub
- Deployment to Kubernetes
- Docker Hub: Used as a container registry to store and distribute Docker images.
- Kubernetes Cluster: Two Ubuntu 22.04 T2 Large instances set up as Kubernetes Master and Slave for orchestrating containerized applications.
- TMDB Movie Search API: An external API integrated into the application for movie data.
- Netflix App: The final application, likely a movie streaming or browsing service, accessed through a web browser.
The workflow appears to be:
- Code is pushed to GitHub
- Jenkins pipeline is triggered
- Code is analyzed, tested, and scanned for vulnerabilities
- Docker image is built and pushed to Docker Hub
- The application is deployed to the Kubernetes cluster
- Users can access the app and integrates with the TMDB API for movie data
This setup demonstrates a modern DevOps approach with continuous integration, delivery, and deployment, along with security scanning and containerized application management.
Brief on Technologies used:
1. Ubuntu (22.04 and 20.04)
- Description: Ubuntu is a popular open-source Linux distribution. It is known for its ease of use, robust performance, and security features.
- Use: The base operating system for all the instances used in this architecture.
2. AWS EC2 T2 Large Instance
- Description: Amazon Elastic Compute Cloud (EC2) provides resizable compute capacity in the cloud. The T2 large instance type offers a balance of compute, memory, and network resources.
- Use: Hosts the Ubuntu server where various tools and applications are installed and run.
3. Jenkins
- Description: Jenkins is an open-source automation server that helps automate the parts of software development related to building, testing, and deploying.
- Use: Automates the build and deployment pipeline.
4. Docker
- Description: Docker is a platform that uses OS-level virtualization to deliver software in packages called containers. Containers are isolated from one another and bundle their own software, libraries, and configuration files.
- Use: Containerizes applications like SonarQube and manages Docker images and containers.
5. Trivy
- Description: Trivy is a comprehensive security scanner for vulnerabilities in container images, file systems, and Git repositories, as well as for configuration issues.
- Use: Scans Docker images for vulnerabilities.
6. SonarQube
- Description: SonarQube is an open-source platform for continuous inspection of code quality to perform automatic reviews with static analysis of code to detect bugs, code smells, and security vulnerabilities.
- Use: Ensures code quality through static analysis within a Docker container.
7. TMDB API
- Description: The Movie Database (TMDB) API provides access to a large database of movie and TV information, including details like ratings, cast, and summaries.
- Use: Integrates movie and TV data within the application.
8. Prometheus
- Description: Prometheus is an open-source monitoring and alerting toolkit designed for reliability and scalability. It collects and stores metrics as time series data.
- Use: Monitors the performance and health of the applications and infrastructure.
9. Grafana
- Description: Grafana is an open-source platform for monitoring and observability. It provides tools to query, visualize, alert on, and understand your metrics.
- Use: Visualizes data collected by Prometheus in dashboards.
10. Email Server
- Description: A server that handles email sending and receiving. Commonly used email servers include SMTP servers.
- Use: Integrates with Jenkins to send notifications and alerts.
11. JDK (Java Development Kit)
- Description: The JDK is a software development kit required to develop Java applications and applets.
- Use: Provides the necessary tools and libraries to build Java applications within Jenkins.
12. SonarQube Scanner
- Description: A command-line tool that analyzes source code and sends the results to the SonarQube server.
- Use: Scans the codebase for issues and quality metrics.
13. Node.js
- Description: Node.js is a JavaScript runtime built on Chrome’s V8 JavaScript engine, enabling server-side scripting.
- Use: Provides the runtime for building and running JavaScript applications.
14. OWASP Dependency Check
- Description: An open-source tool that identifies project dependencies and checks if there are any known, publicly disclosed vulnerabilities.
- Use: Scans for vulnerabilities in project dependencies.
15. Docker Registry
- Description: A storage and distribution system for Docker images. Docker Hub is a popular public registry.
- Use: Stores Docker images built in the pipeline.
16. Kubernetes
- Description: Kubernetes is an open-source system for automating the deployment, scaling, and management of containerized applications.
- Use: Orchestrates and manages Docker containers across multiple hosts (master and worker nodes).
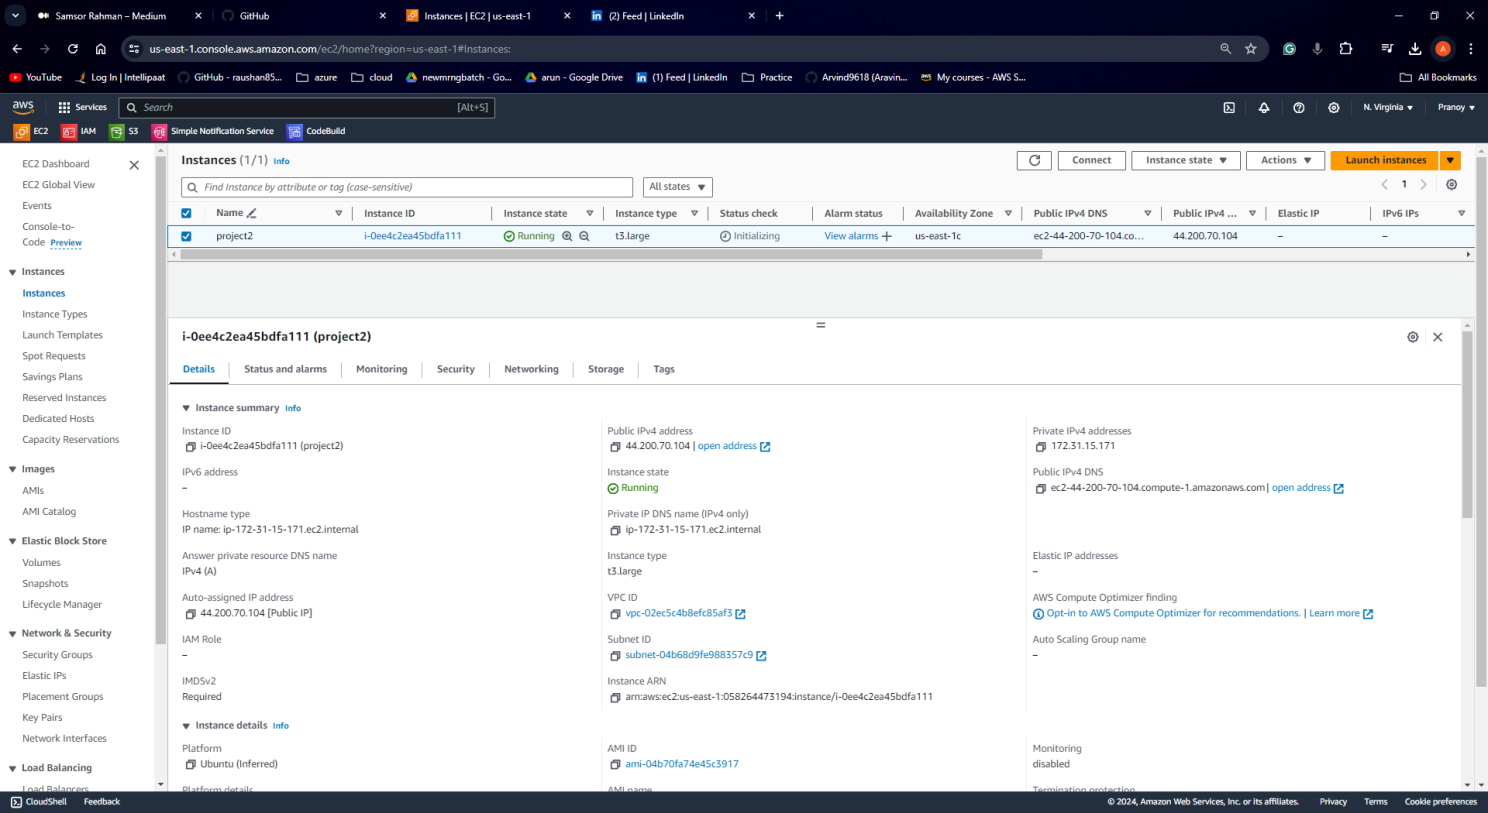
STEP1:Launch an Ubuntu(22.04) T2 Large Instance
Launch an AWS T2 Large Instance, use the image as Ubuntu. You can create a new key pair or use an existing one. Enable HTTP and HTTPS settings in the Security Group and open the required ports.
Step 2 — Install Jenkins, Docker, and Trivy; Create a SonarQube Container using Docker
- Description: Install Jenkins, Docker, and Trivy. Create a SonarQube container using Docker.
ssh in ec2 ubuntu instance and create the below-attached script with the name Jenkins and save with sh extension.
vi Jenkins.sh and the code in the repo.
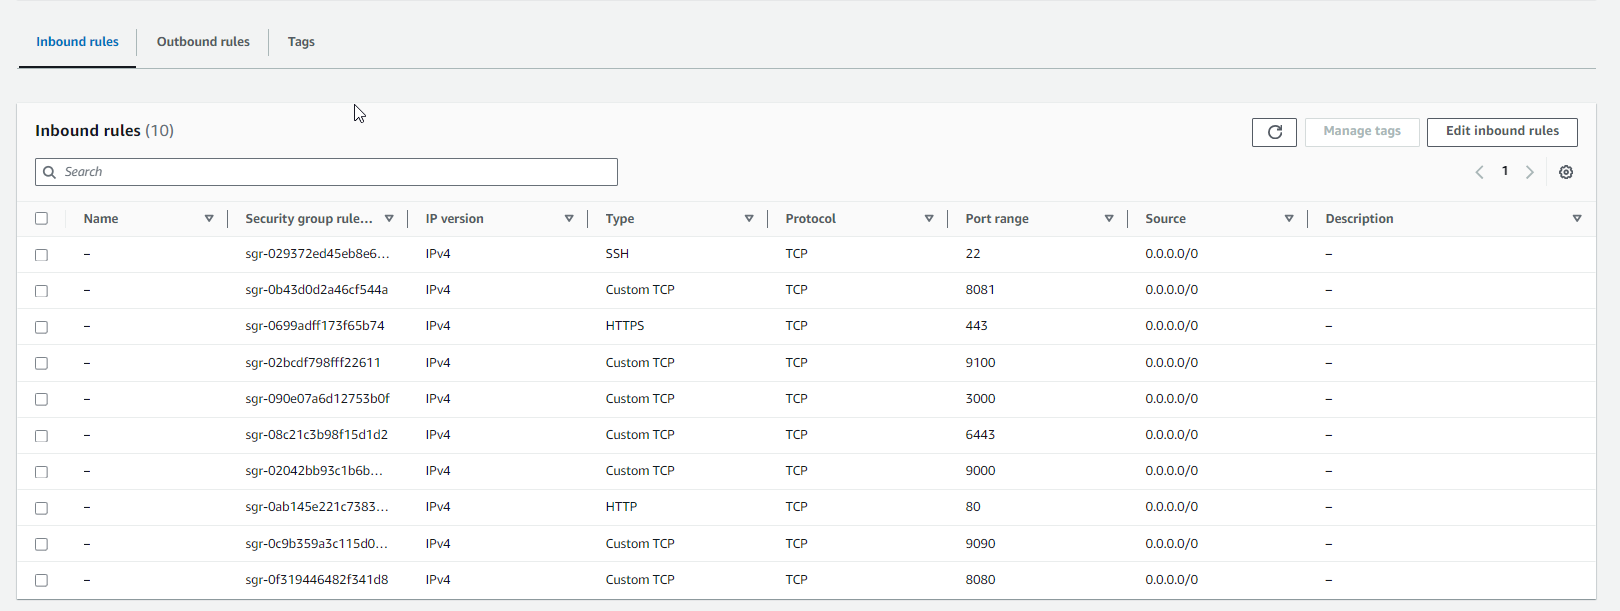
sudo chmod 777 jenkins.sh./jenkins.sh # this will installl jenkinsOnce Jenkins is installed, you will need to go to your AWS EC2 Security Group and open Inbound Port 8080, since Jenkins works on Port 8080.
sudo systemctl status jenkins #check the status of the jenkinsStep 2: Install Jenkins, Docker, and Trivy; Create a SonarQube Container using Docker
sudo apt-get update
sudo apt-get install docker.io -y
sudo usermod -aG docker $USER   #my case is ubuntu
newgrp docker
sudo chmod 777 /var/run/docker.sock
After the docker installation, we create a sonarqube container (Remember to add 9000 ports in the security group).
docker run -d --name sonar -p 9000:9000 sonarqube:lts-community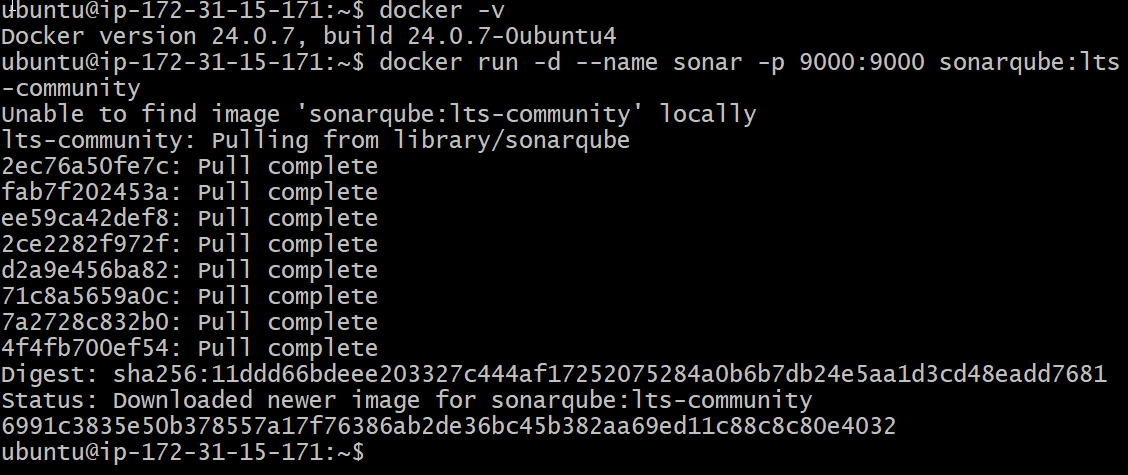
Install Trivy
vi trivy.shCopy the following commands and paste them into your file.
sudo apt-get install wget apt-transport-https gnupg lsb-release -y
wget -qO - https://aquasecurity.github.io/trivy-repo/deb/public.key | gpg --dearmor | sudo tee /usr/share/keyrings/trivy.gpg > /dev/null
echo "deb [signed-by=/usr/share/keyrings/trivy.gpg] https://aquasecurity.github.io/trivy-repo/deb $(lsb_release -sc) main" | sudo tee -a /etc/apt/sources.list.d/trivy.list
sudo apt-get update
sudo apt-get install trivy -y
Step 3: Install Prometheus and Grafana
let’s create a dedicated Linux user sometimes called a system account for Prometheus. Having individual users for each service serves two main purposes:
It is a security measure to reduce the impact in case of an incident with the service.
It simplifies administration as it becomes easier to track down what resources belong to which service.
To create a system user or system account, run the following command:
sudo useradd \
    --system \
    --no-create-home \
    --shell /bin/false prometheus
Command Breakdown:
- sudo: Indicates that the command requires administrative privileges (root access).
- useradd: The command itself, used for creating new user accounts.
- –system: Creates a system user, meaning it’s not intended for interactive logins but for running automated processes or services.
- –no-create-home: Skips creation of the user’s home directory. This is often used with system users as they don’t typically need one.
- –shell /bin/false: Sets the user’s login shell to /bin/false, which prevents any login attempts. This further secures the account by making it inaccessible for direct logins.
- prometheus: Specifies the username to create, in this case “prometheus”.
check the latest version of Prometheus from the download page.
You can use the curl or wget command to download Prometheus.
wget https://github.com/prometheus/prometheus/releases/download/v2.53.0/prometheus-2.53.0.linux-amd64.tar.gzThen, we need to extract all Prometheus files from the archive.
tar -xvf prometheus-2.53.0.linux-amd64.tar.gz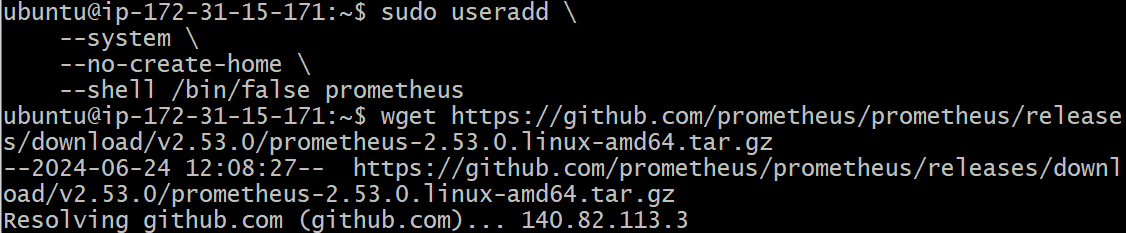
sudo mkdir -p /data /etc/prometheus
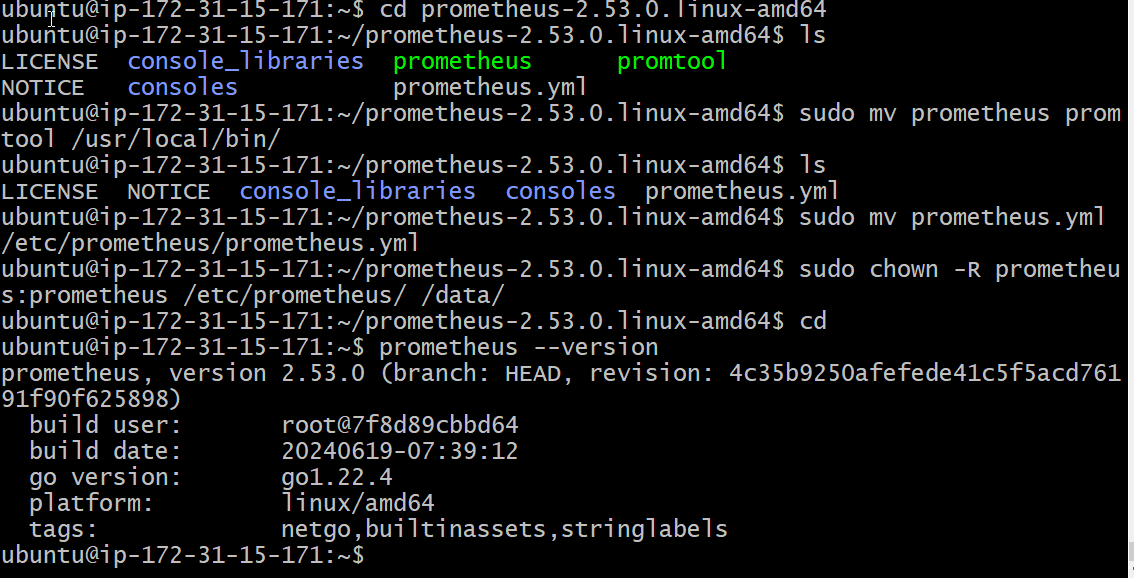
Now, let’s change the directory to Prometheus and move some files.
cd prometheus-2.53.0.linux-amd64/First of all, let’s move the Prometheus binary and a promtool to the /usr/local/bin/. Promtool is used to check configuration files and Prometheus rules.
sudo mv prometheus promtool /usr/local/bin/Finally, let’s move the example of the main Prometheus configuration file.
sudo mv prometheus.yml /etc/prometheus/prometheus.ymlTo avoid permission issues, you need to set the correct ownership for the /etc/prometheus/ and data directory.
sudo chown -R prometheus:prometheus /etc/prometheus/ /data/Command Breakdown:
- sudo: Indicates this command requires administrative privileges (root access) due to its potential to modify system files.
- chown: The command itself is used for changing ownership of files and directories.
- -R: Applies the change recursively, meaning it affects not only the specified directories but also all files and subdirectories within them.
- “prometheus:prometheus”: Sets the owner of the directories and their contents to the user named “Prometheus” and the group also named “prometheus”.
Verify that you can execute the Prometheus binary by running the following command:
prometheus --version
The prometheus.service file is a systemd service unit file used to manage the Prometheus monitoring system as a service on Linux systems. It defines how Prometheus should be started, stopped, and managed by the systemd init system. Here’s a detailed explanation of its use:
We’re going to use Systemd, which is a system and service manager for Linux operating systems. For that, we need to create a Systemd unit configuration file.
sudo vim /etc/systemd/system/prometheus.servicePrometheus.service
[Unit]
Description=Prometheus
Wants=network-online.target
After=network-online.target

StartLimitIntervalSec=500
StartLimitBurst=5

[Service]
User=prometheus
Group=prometheus
Type=simple
Restart=on-failure
RestartSec=5s
ExecStart=/usr/local/bin/prometheus \
  --config.file=/etc/prometheus/prometheus.yml \
  --storage.tsdb.path=/data \
  --web.console.templates=/etc/prometheus/consoles \
  --web.console.libraries=/etc/prometheus/console_libraries \
  --web.listen-address=0.0.0.0:9090 \
  --web.enable-lifecycle

[Install]
WantedBy=multi-user.target
To enable the Prometheus service so that it starts automatically on boot, you would use the systemctl enable command.
sudo systemctl enable prometheusStart the Prometheus service:
sudo systemctl start prometheusTo check the status of Prometheus run the following command:
sudo systemctl status prometheusIf got any error
sudo journalctl -u prometheus -f --no-pagerThe command journalctl -u prometheus -f –no-pager is used to view the real-time logs of the Prometheus service. Here’s a breakdown of what each part of the command does:
- journalctl: This is the command used to query and display logs from the systemd journal.
- -u prometheus: This option specifies the unit for which you want to view the logs. In this case, it’s the prometheus service.
- -f: This option makes the command follow the log output in real-time, similar to tail -f.
- –no-pager: This option disables the use of the pager, making the output more continuous and easier to read in real-time.
Install Node Exporter on Ubuntu 22.04
Next, we’re going to set up and configure Node Exporter to collect Linux system metrics like CPU load and disk I/O. Node Exporter will expose these as Prometheus-style metrics. Since the installation process is very similar, I’m not going to cover as deep as Prometheus.
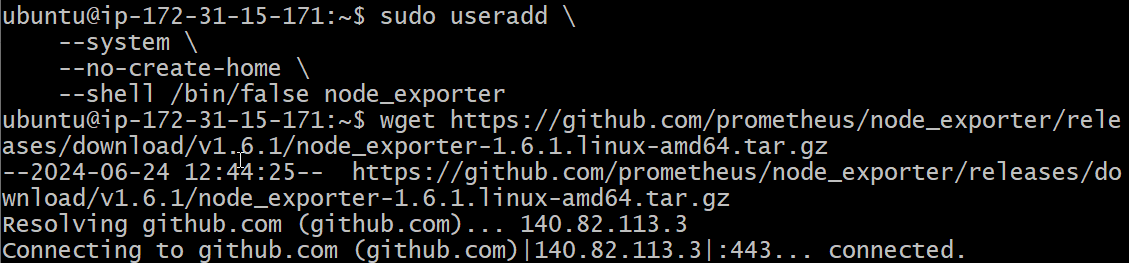
First, let’s create a system user for Node Exporter by running the following command:
sudo useradd \
    --system \
    --no-create-home \
    --shell /bin/false node_exporter
You can download Node Exporter from the same page.
Use the wget command to download the binary.
wget https://github.com/prometheus/node_exporter/releases/download/v1.6.1/node_exporter-1.6.1.linux-amd64.tar.gzExtract the node exporter from the archive.
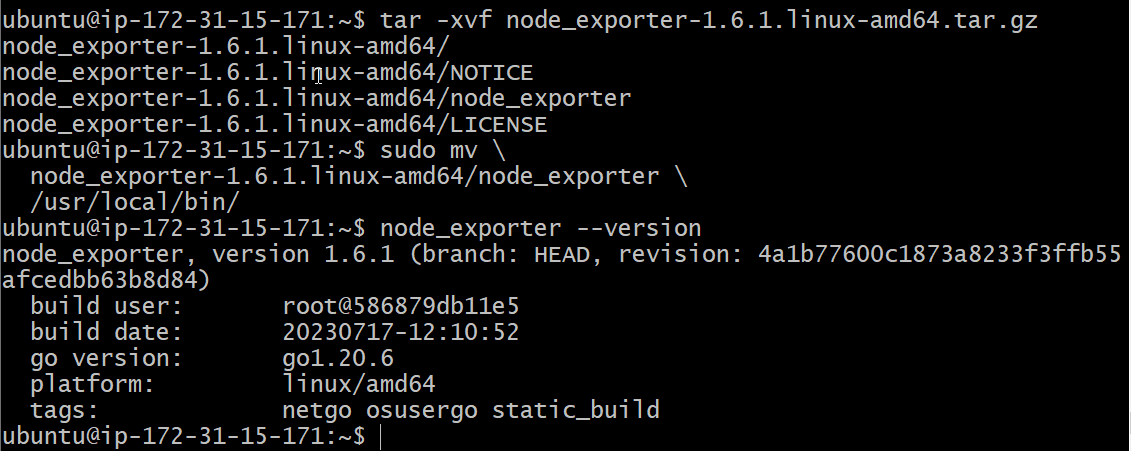
tar -xvf node_exporter-1.6.1.linux-amd64.tar.gzMove binary to the /usr/local/bin.
sudo mv \
  node_exporter-1.6.1.linux-amd64/node_exporter \
  /usr/local/bin/
Verify that you can run the binary.
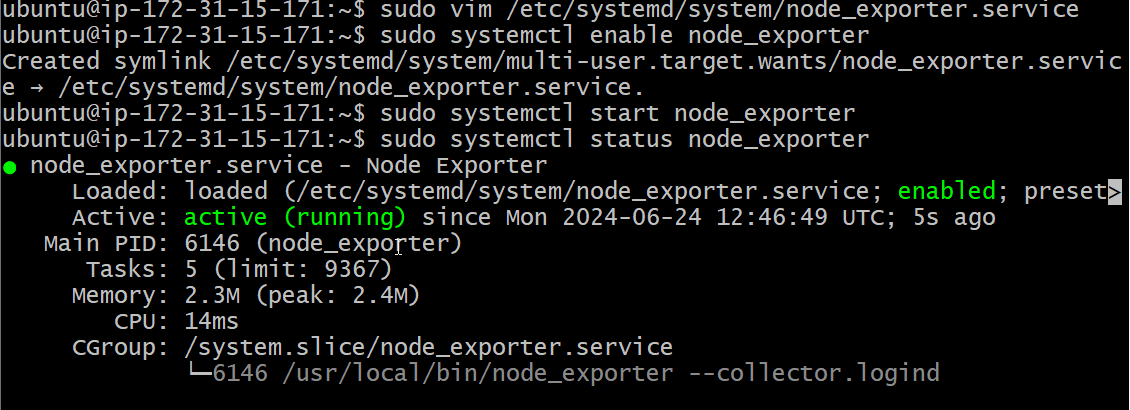
node_exporter --versionNext, create a similar systemd unit file.
sudo vim /etc/systemd/system/node_exporter.service[Unit]
Description=Node Exporter
Wants=network-online.target
After=network-online.target
StartLimitIntervalSec=500
StartLimitBurst=5
[Service]
User=node_exporter
Group=node_exporter
Type=simple
Restart=on-failure
RestartSec=5s
ExecStart=/usr/local/bin/node_exporter \
--collector.logind
[Install]
WantedBy=multi-user.targetTo enable the Node Exporter so that it starts automatically on boot, you would use the systemctl enable command.
sudo systemctl enable node_exporterstart the Node Exporter.
sudo systemctl start node_exporterCheck the status of Node Exporter with the following command:
sudo systemctl status node_exporter
If you have any issues, check logs with journalctl
journalctl -u node_exporter -f --no-pagerAt this point, we have only a single target in our Prometheus. There are many different service discovery mechanisms built into Prometheus. For example, Prometheus can dynamically discover targets in AWS, GCP, and other clouds based on the labels. In the following tutorials, I’ll give you a few examples of deploying Prometheus in a cloud-specific environment. For this tutorial, let’s keep it simple and keep adding static targets. Also, I have a lesson on how to deploy and manage Prometheus in the Kubernetes cluster.
To create a static target, you need to add job_name with static_configs.
sudo vim /etc/prometheus/prometheus.yml- job_name: node_export
static_configs:
- targets: ["localhost:9100"]By default, Node Exporter will be exposed on port 9100.
Since we enabled lifecycle management via API calls, we can reload the Prometheus config without restarting the service and causing downtime.
Before, restarting check if the config is valid.
promtool check config /etc/prometheus/prometheus.ymlThen, you can use a POST request to reload the config.
curl -X POST http://localhost:9090/-/reloadInstall Grafana on Ubuntu 22.04
To visualize metrics we can use Grafana. There are many different data sources that Grafana supports, one of them is Prometheus.
First, let’s make sure that all the dependencies are installed.
sudo apt-get install -y apt-transport-https software-properties-commonNext, add the GPG key.
wget -q -O - https://packages.grafana.com/gpg.key | sudo apt-key add -Add this repository for stable releases.
echo "deb https://packages.grafana.com/oss/deb stable main" | sudo tee -a /etc/apt/sources.list.d/grafana.listAfter you add the repository, update and install Garafana. Simultaneously start and check status of the server.
sudo apt-get update -y
sudo apt-get -y install grafana
sudo systemctl enable grafana-server
sudo systemctl start grafana-server
sudo systemctl status grafana-serverNow go to security groups in your Ec2 and add all the shown ports.
Step 4: Setup Jenkins, Sonarqube, Prometheus, Grafana
Now, grab your Public IP Address
<EC2 Public IP Address:8080>
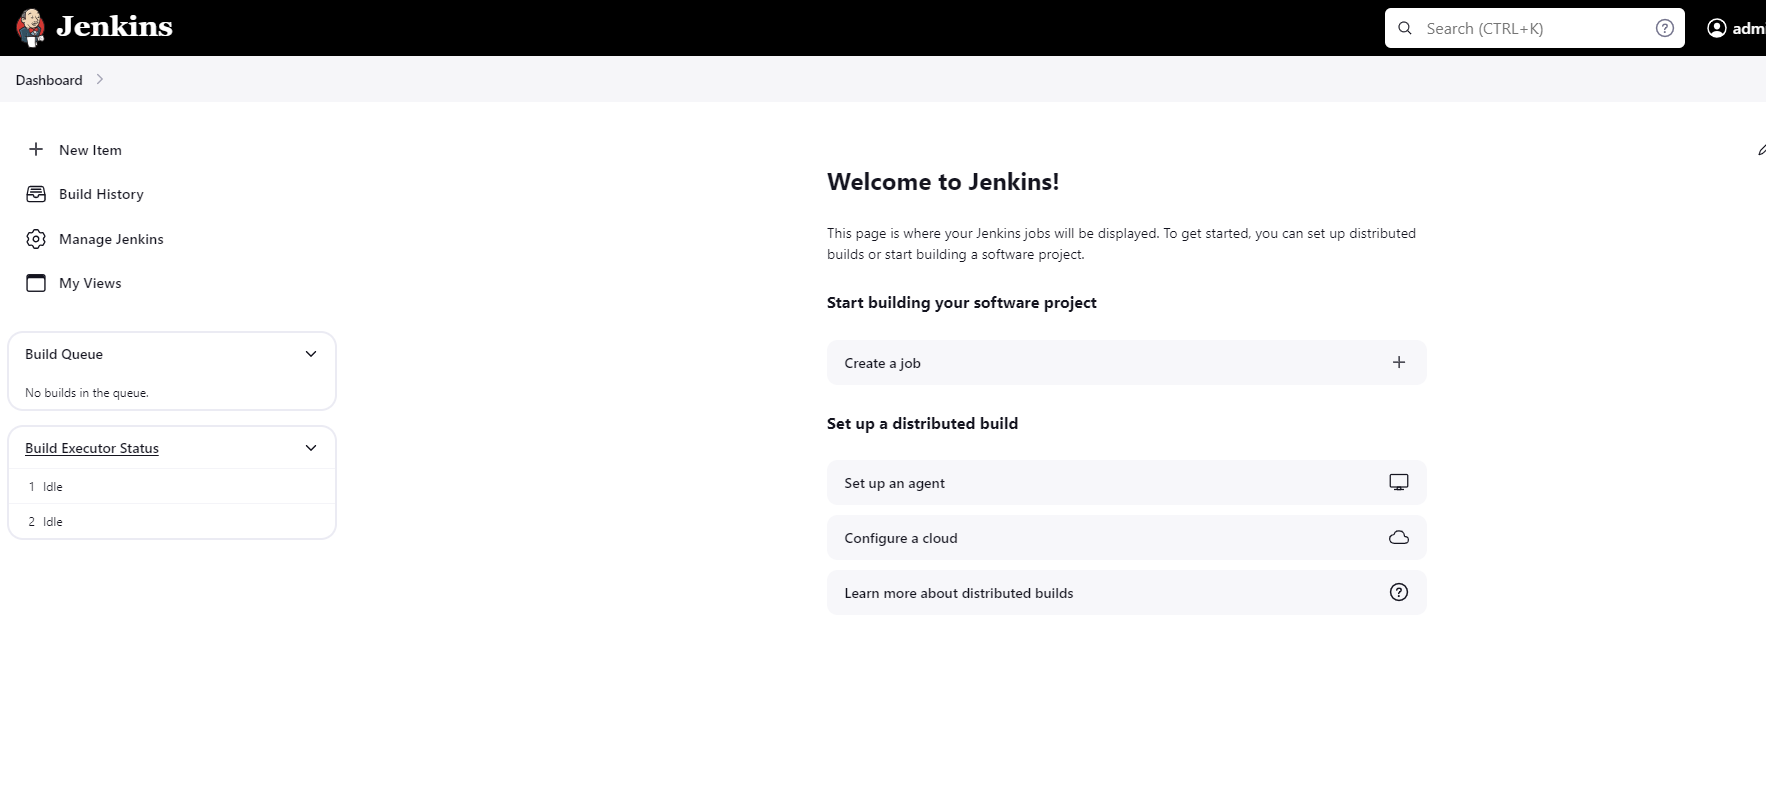
using the above syntax, open Jenkins and configure
In the ec2 instance, enter the following command for the default password by Jenkins.
sudo cat /var/lib/jenkins/secrets/initialAdminPasswordUnlock Jenkins and Select suggested plugins.
In the next step, configure all the details.
Install necessary plugins on Jenkins server.
Navigate to the left pane and go to Plugins by following this address Manage Jenkins > Plugins > Available Plugins.
Now search for the below-mentioned plugins, install them, and restart the Jenkins server.
- Prometheus metrics
- Email extension template
- JDK
- OWASP Dependency Check
- Docker
- Docker Commons
- Docker Pipeline
- Docker API
- docker-build-step
- Kubernetes Credentials
- Kubernetes Client API
- Kubernetes
- Kubernetes CLI
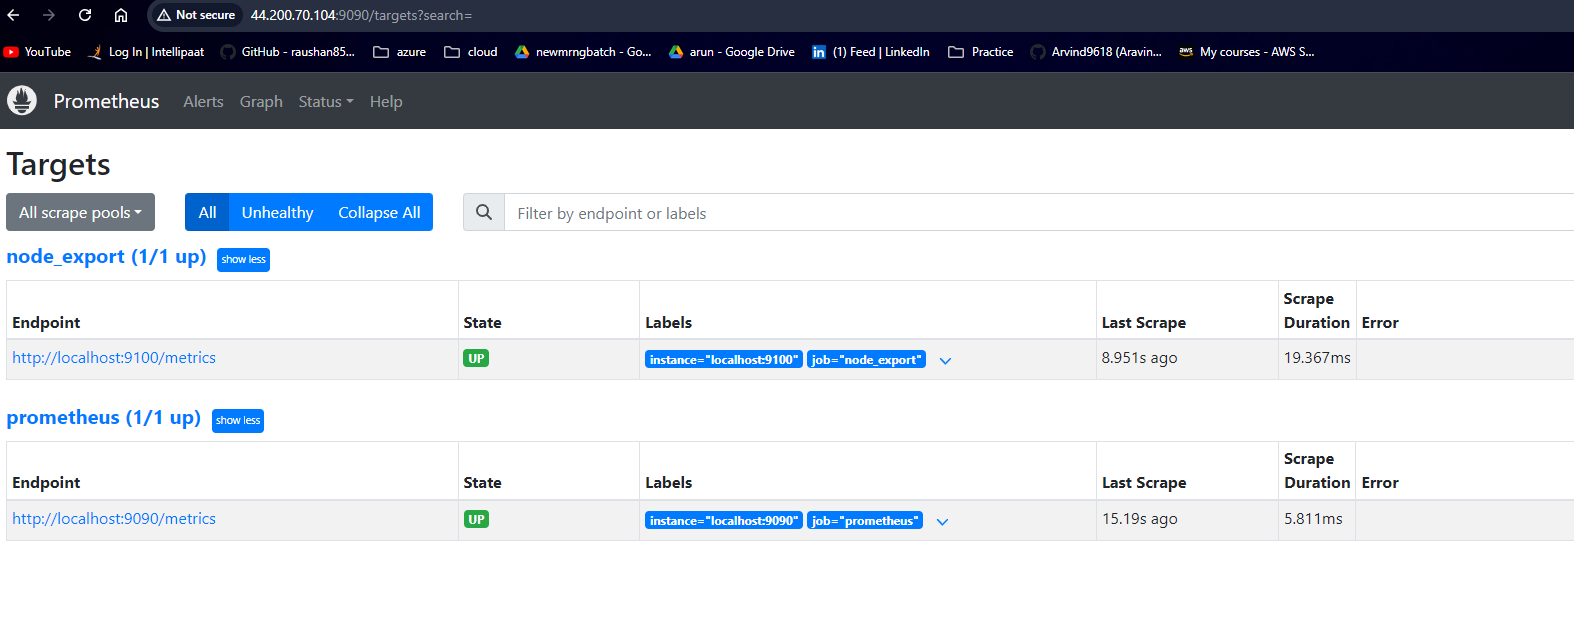
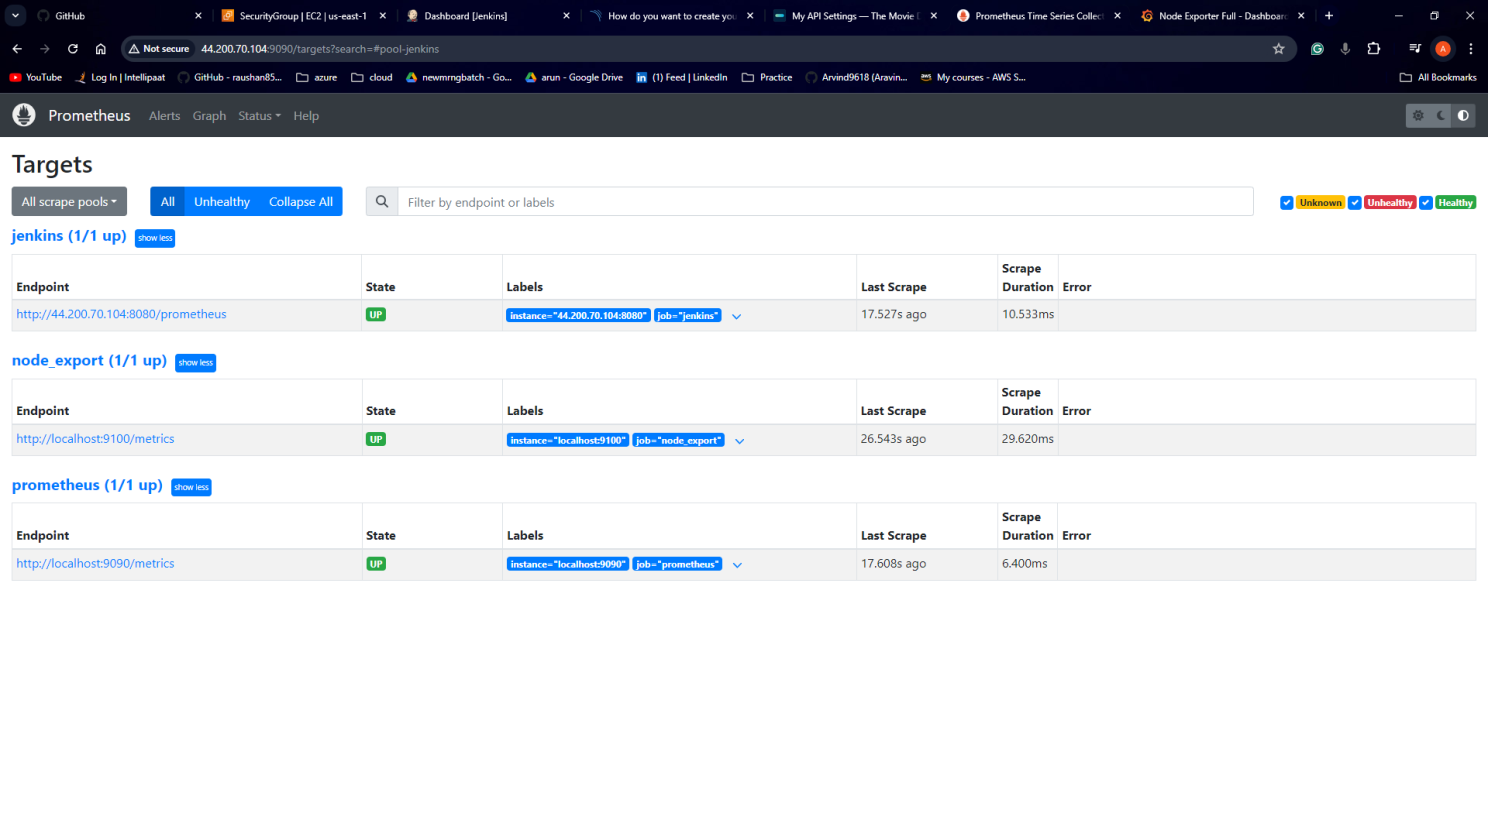
Now on separate browser tab open prometheus and see if you can see all mentioned targets or not:
public-ip-address:9090/targets
Now on separate browser tab and configure Grafana:
Go to http://<ip>:3000 and log in to Grafana using default credentials. The username is admin, and the password is admin as well.
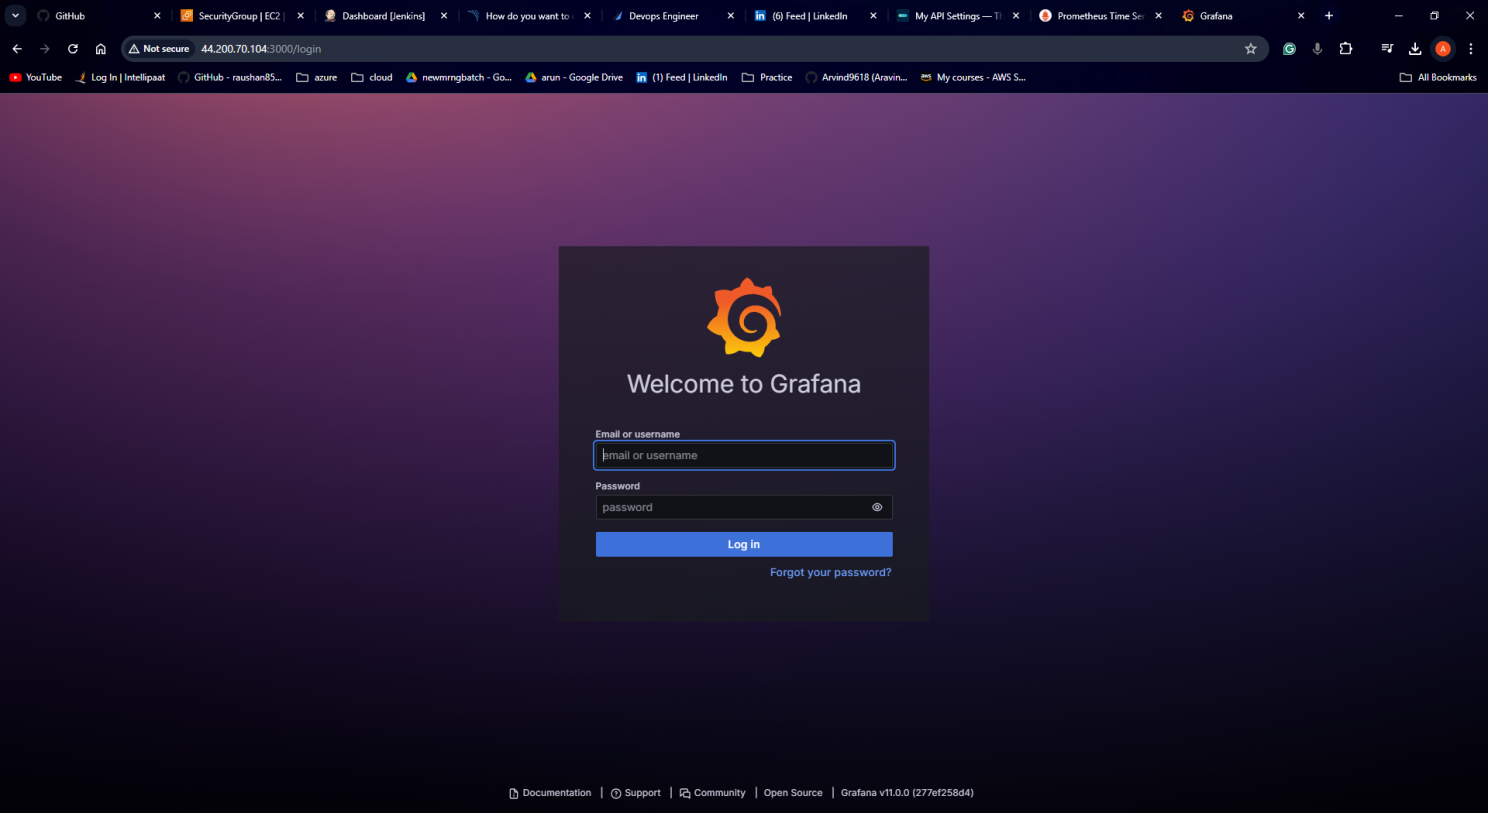
username admin
password adminWhen you log in for the first time, you get the option to change the password.
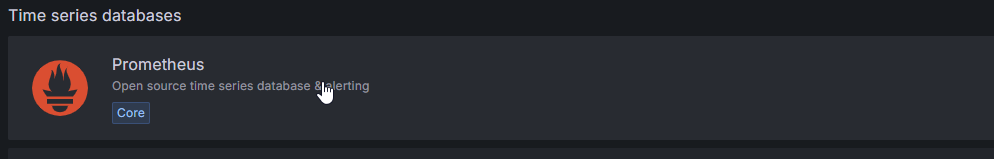
To visualize metrics, you need to add a data source first.
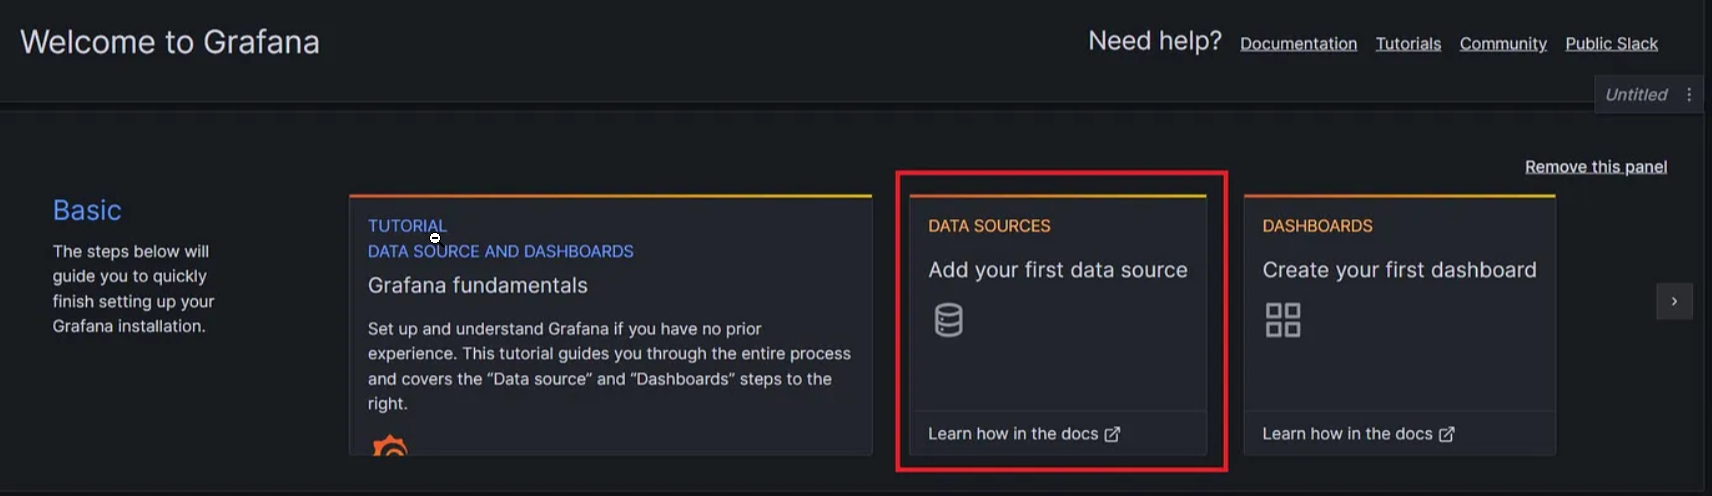
Click Add data source and select Prometheus.
Next, enter your public URL with port no 9090
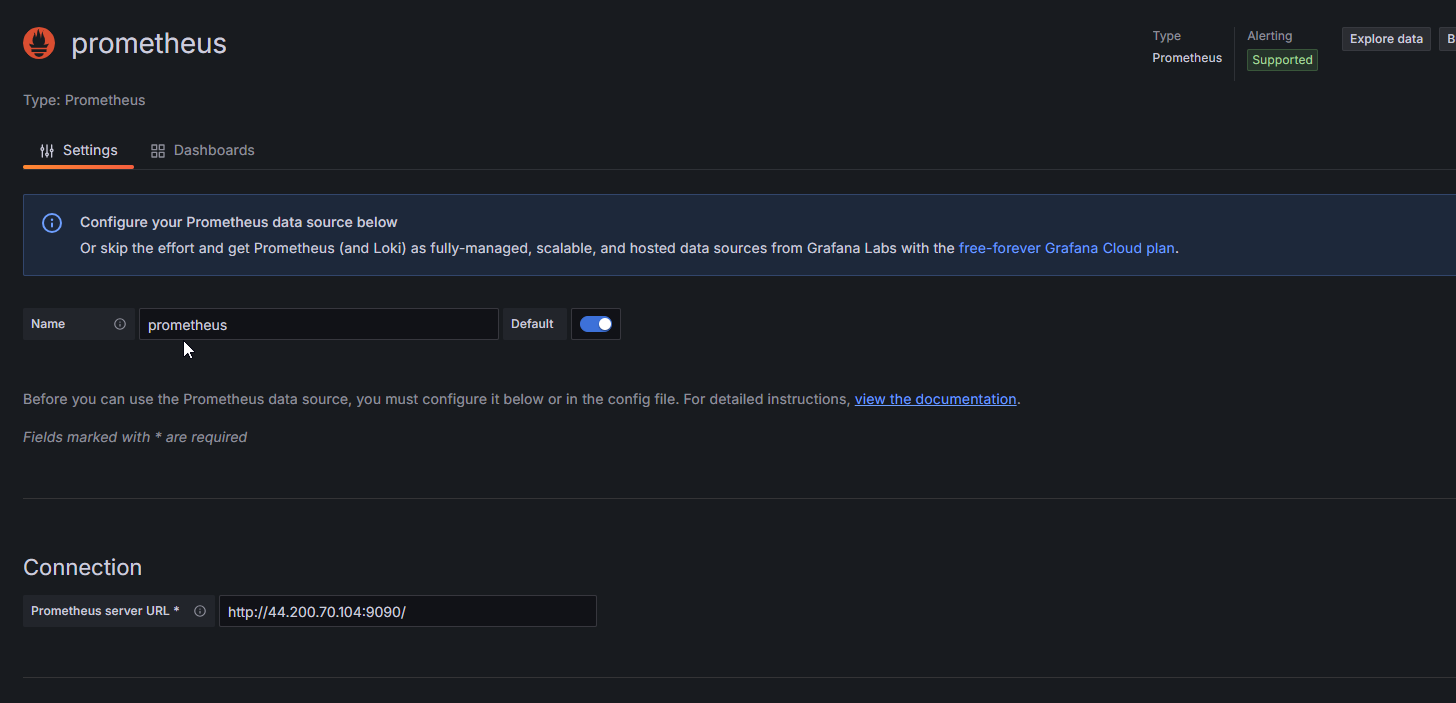
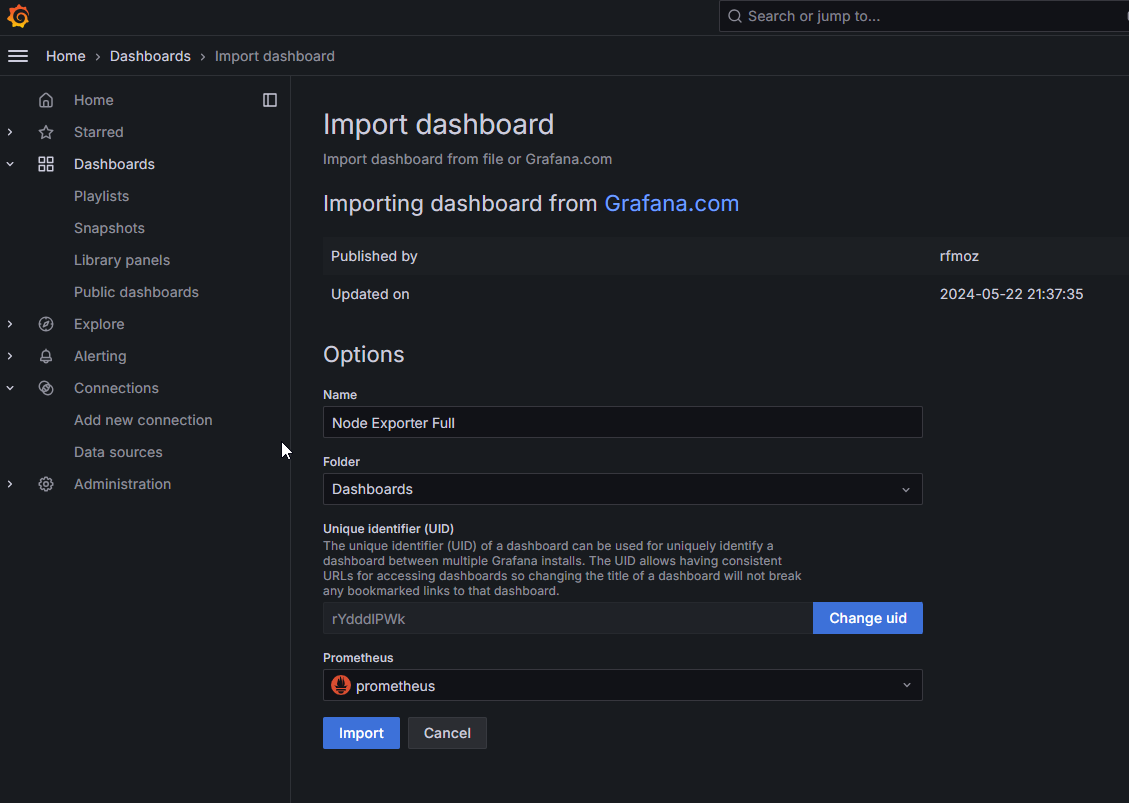
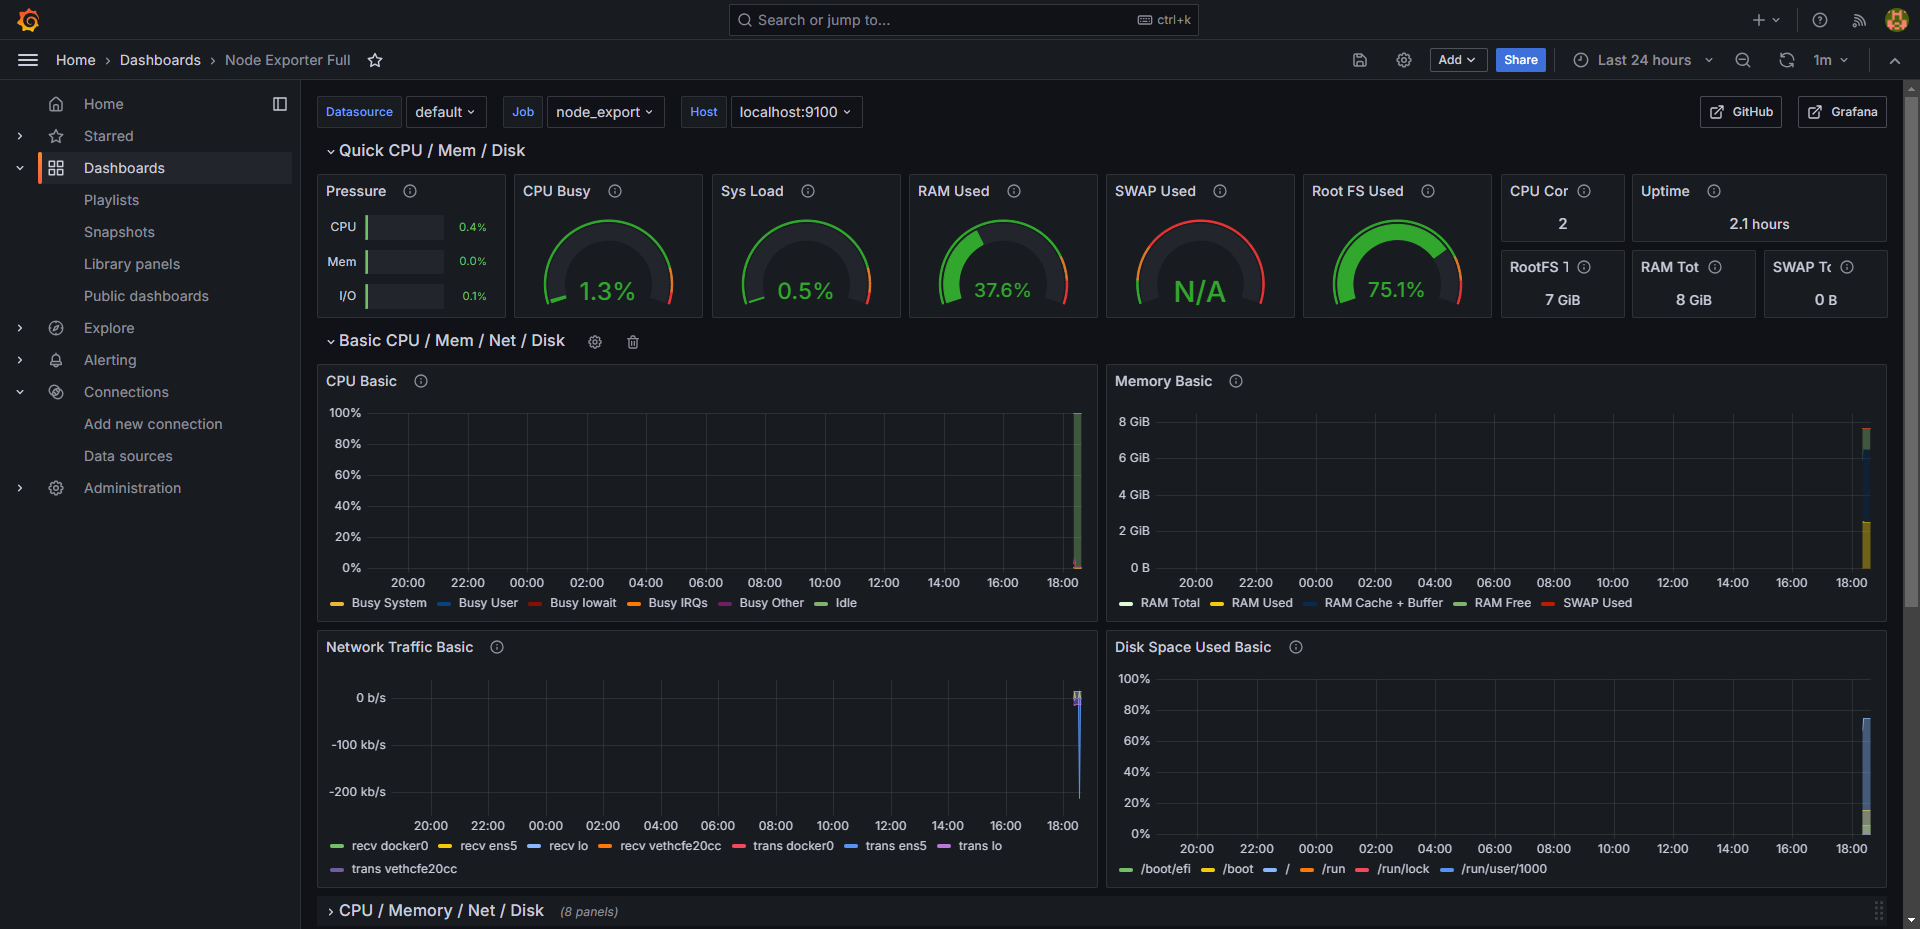
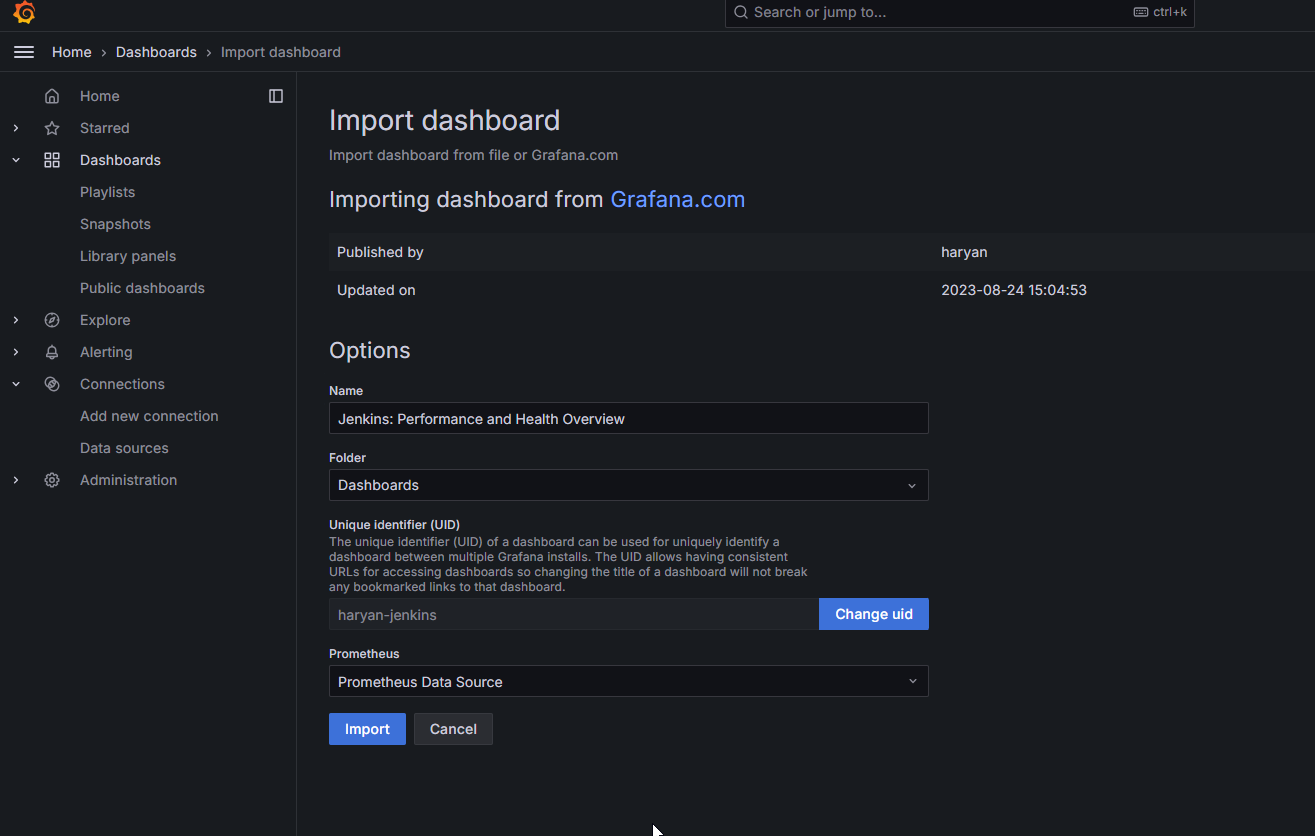
Click on Save and Test. select Import Dashboard and paste the code 1860 and click on Load.
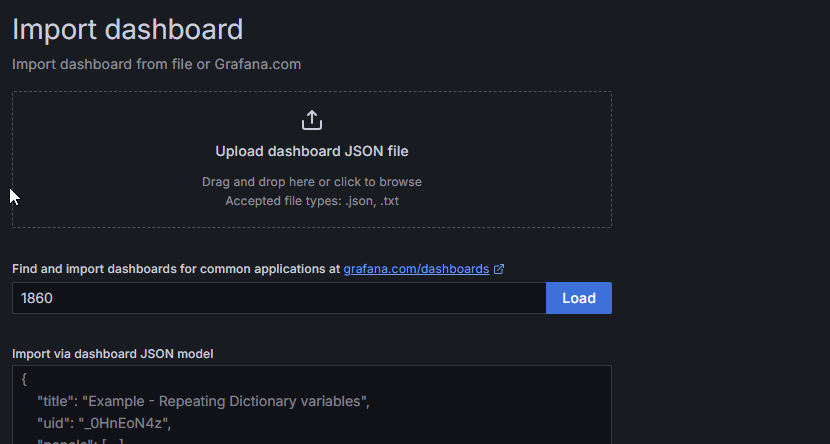
Select the Datasource and click on Import
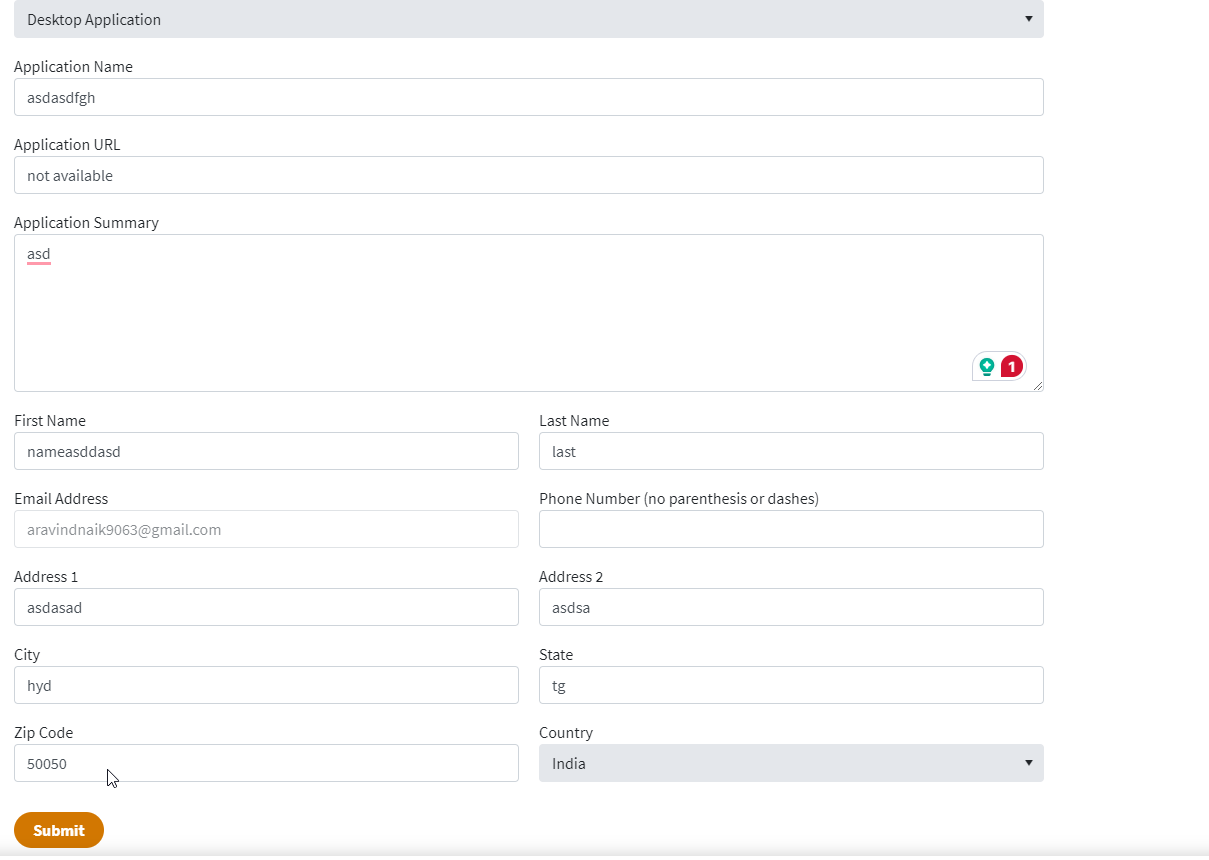
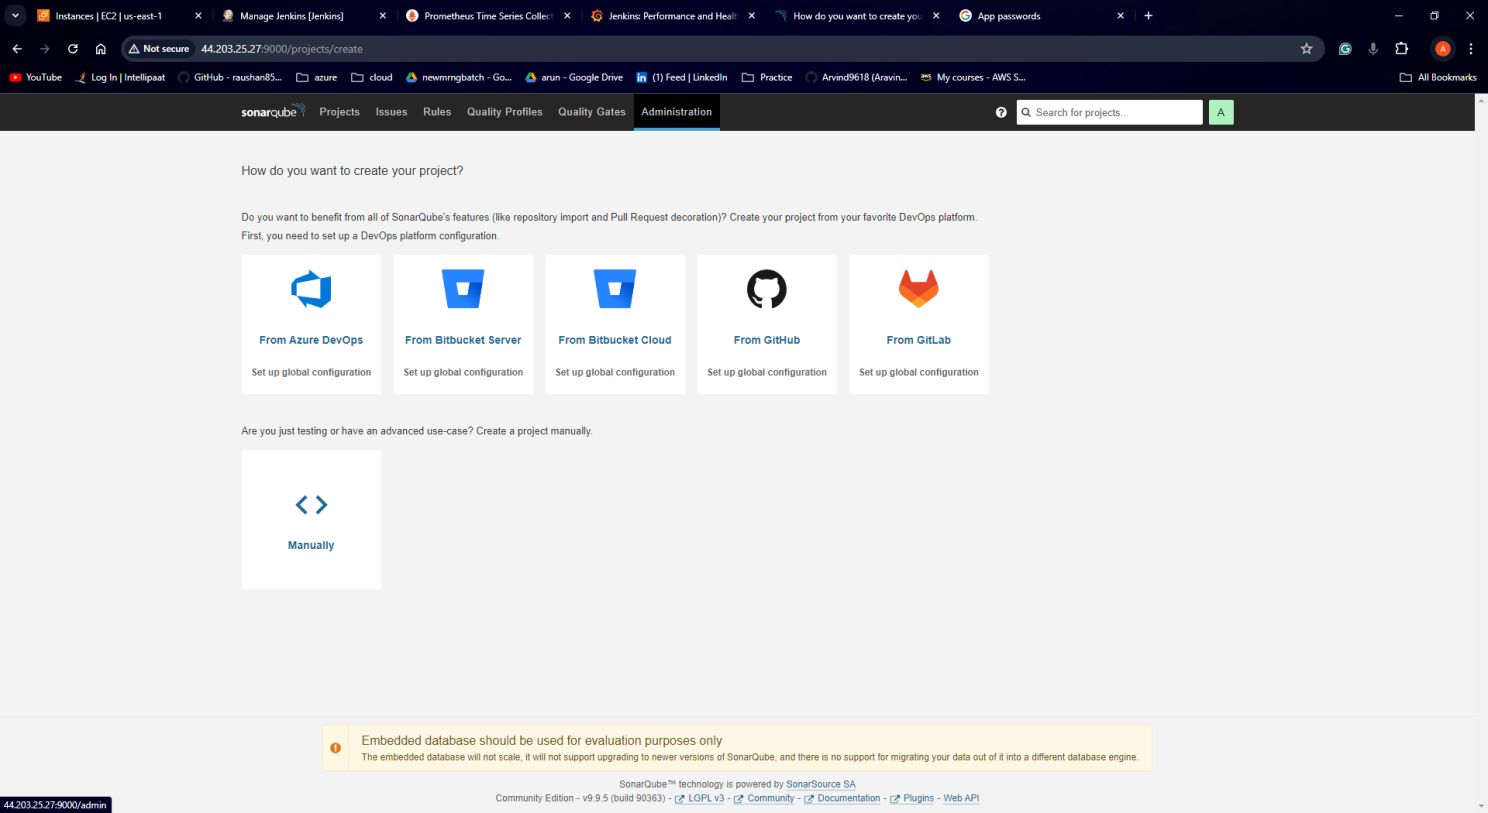
Step 4: Create a TMDB API Key
Next, we will create a TMDB API key
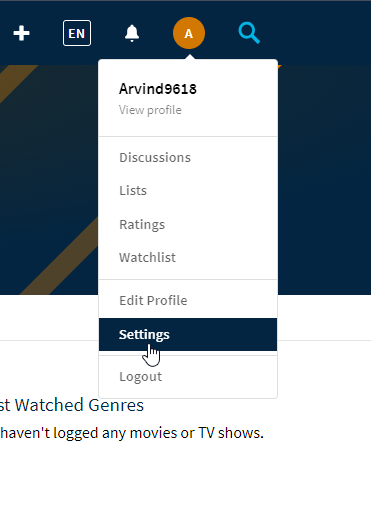
Open a new tab in the Browser and search for TMDB. Click on the first result, Click on the Login on the top right. You will get this page.
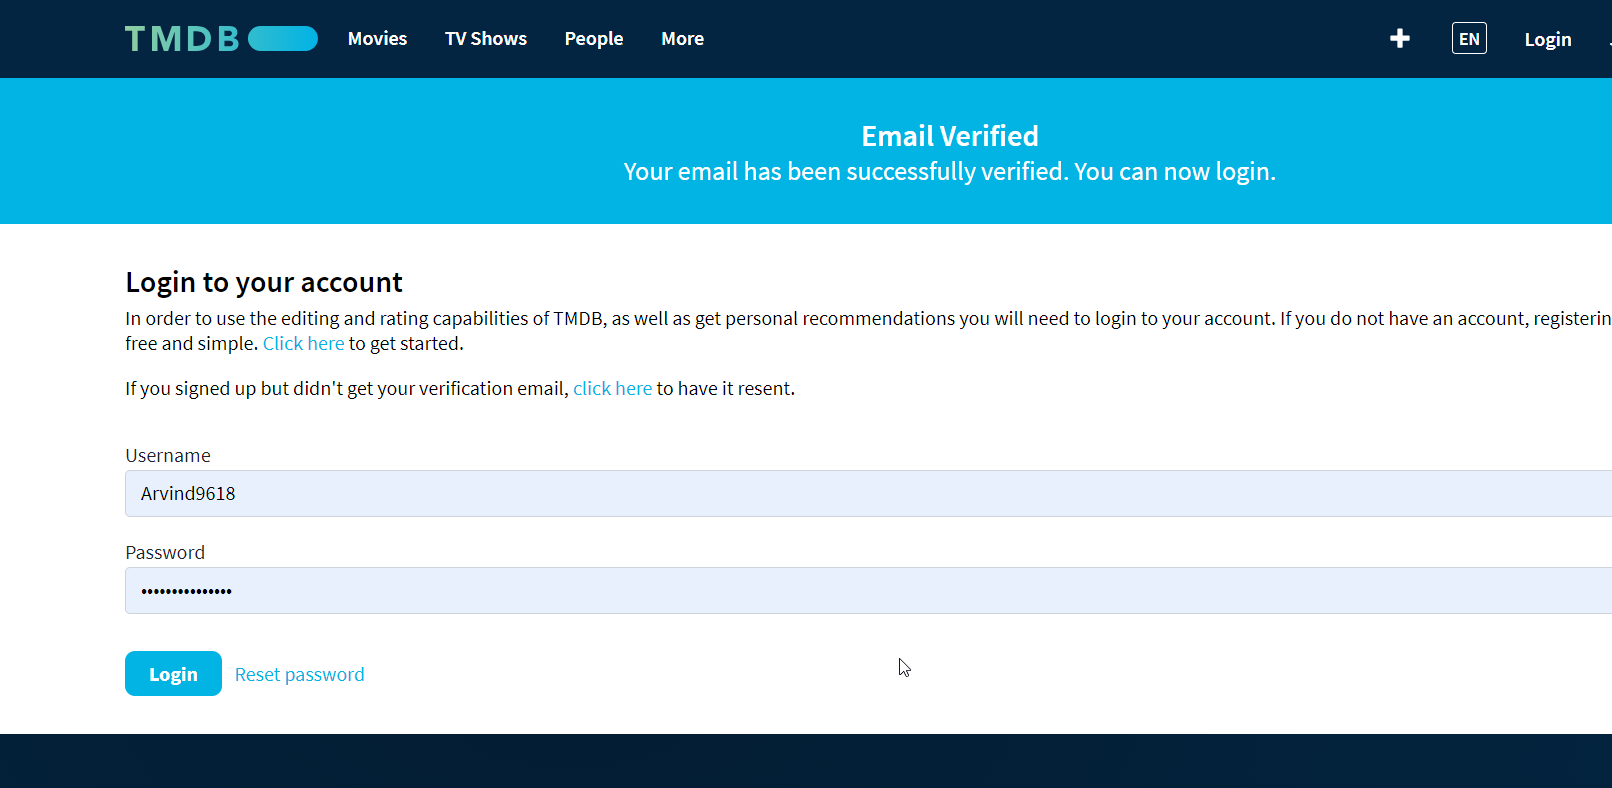
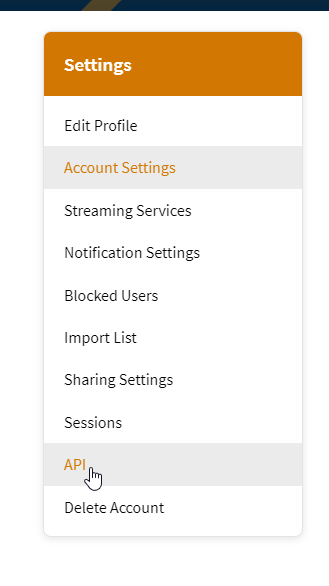
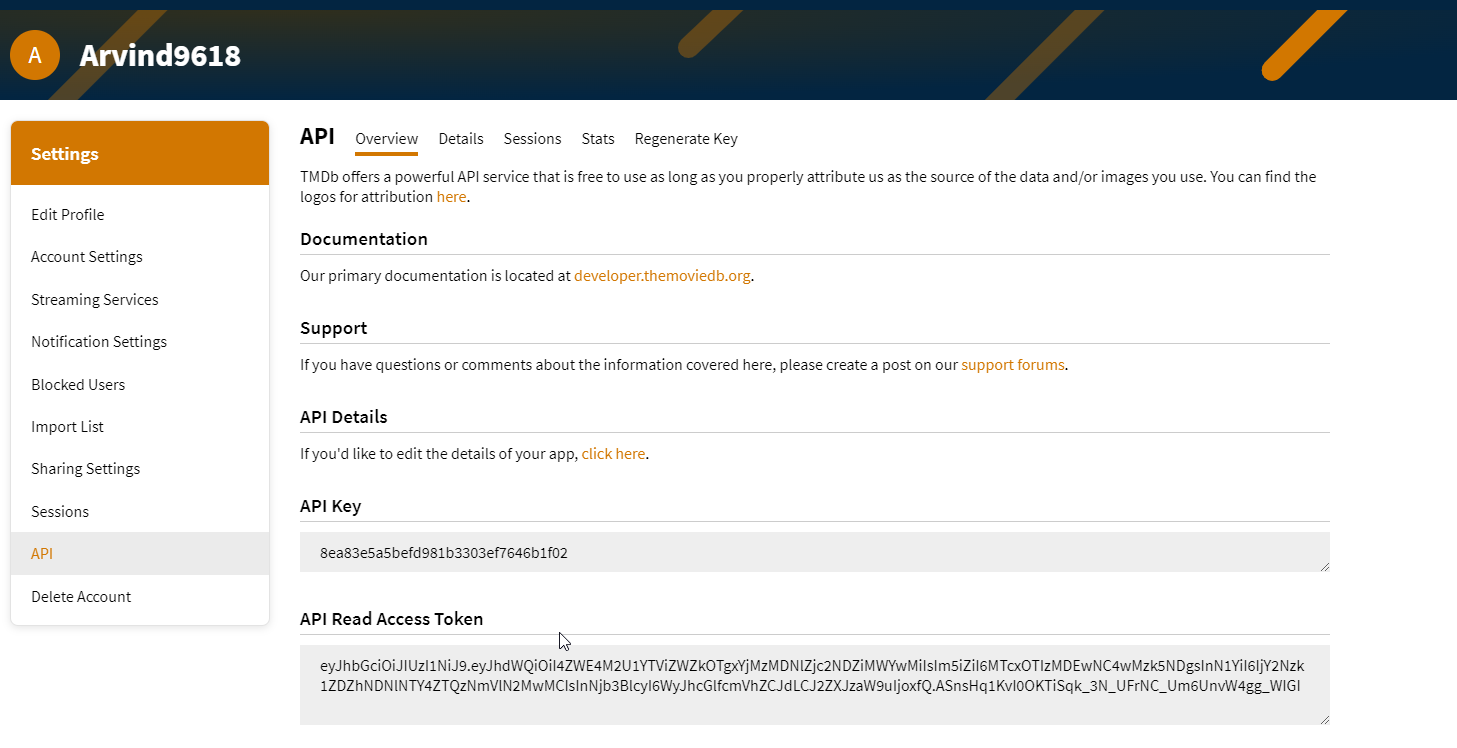
You need to create an account here. click on click here. I have an account that’s why I added my details there. After logging in, go to settings>API>Create>developer and fill out the application. After filling out the form you will get the API and also an email with the API key will be sent save it someplace secure, we need it at last.
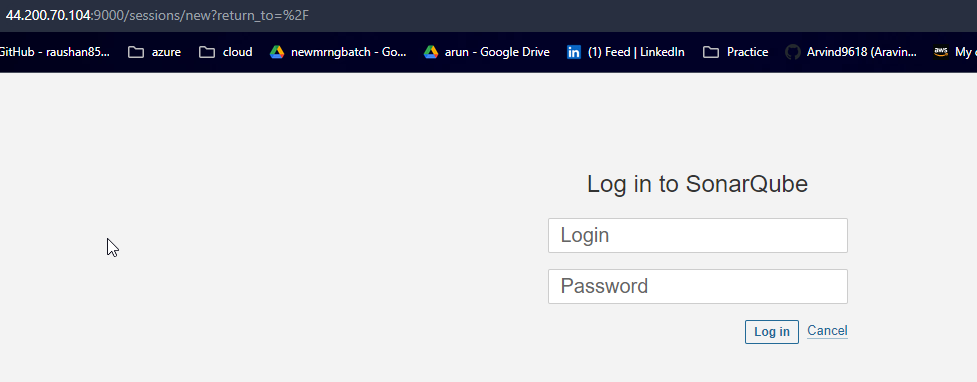
Step 5: Setup Sonarqube
On a new tab open public Ip address with port no 9000 and login to the page with default username and password which isadmin. After loggin in you will be asked to update the password. Update it and proceed further.
Step 6: Integrate all the plugins in jenkins
Go to the Jenkins tab, navigate to Dashboard>Manage Jenkins>System and enter the details as following.
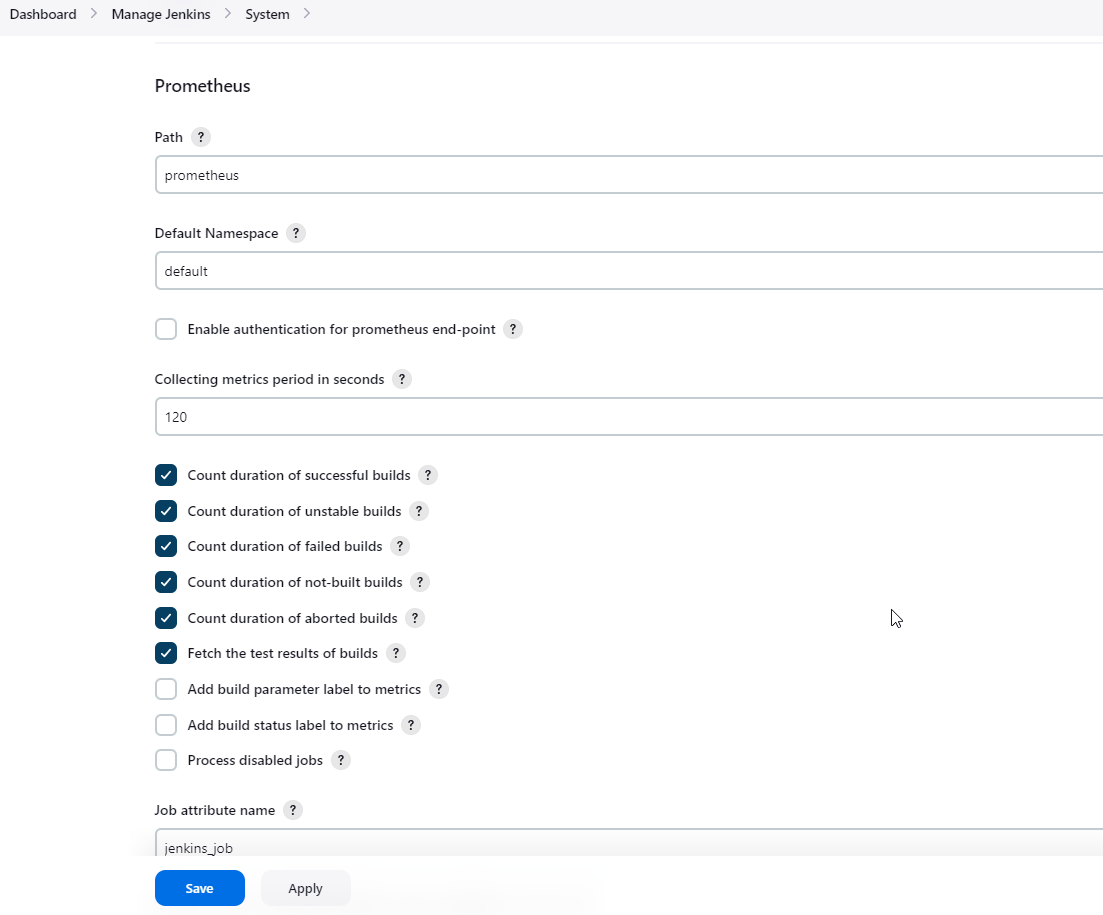
To create a static target, you need to add job_name with static_configs. go to the ec2 instance and enter the following commands.
sudo vim /etc/prometheus/prometheus.yml - job_name: 'jenkins'
metrics_path: '/prometheus'
static_configs:
- targets: ['<jenkins-ip>:8080']check if the config is valid.
promtool check config /etc/prometheus/prometheus.ymlThen, you can use a POST request to reload the config.
curl -X POST http://localhost:9090/-/reloadOpen the Prometheus page and check if Jenkins has been added to targets list or not.
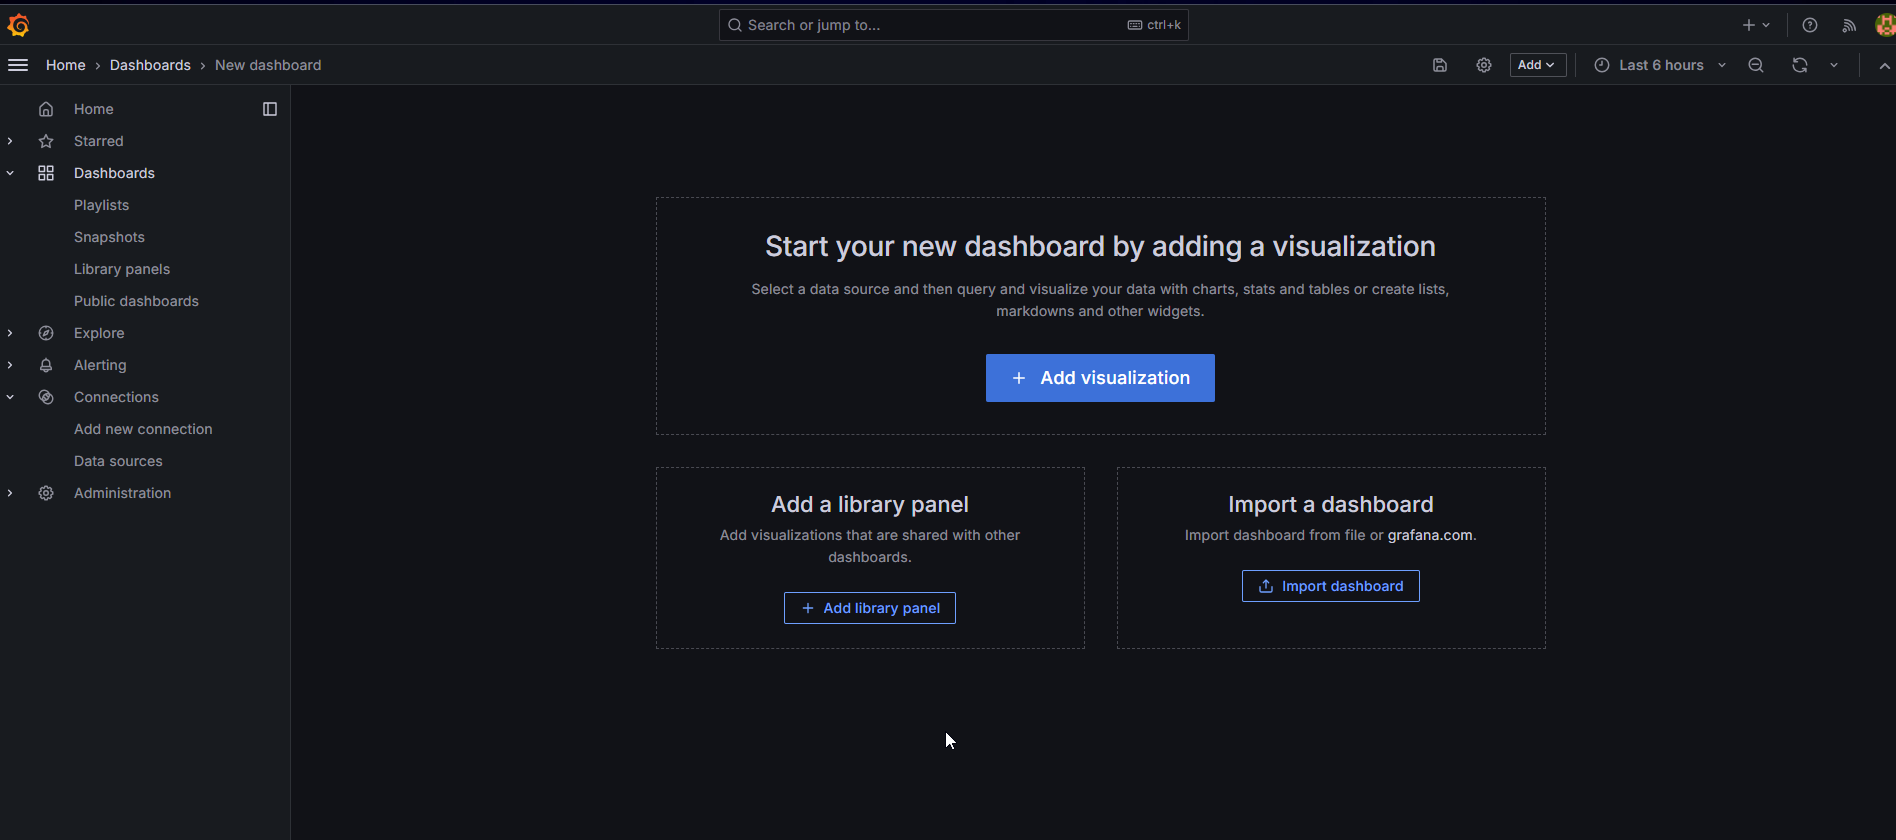
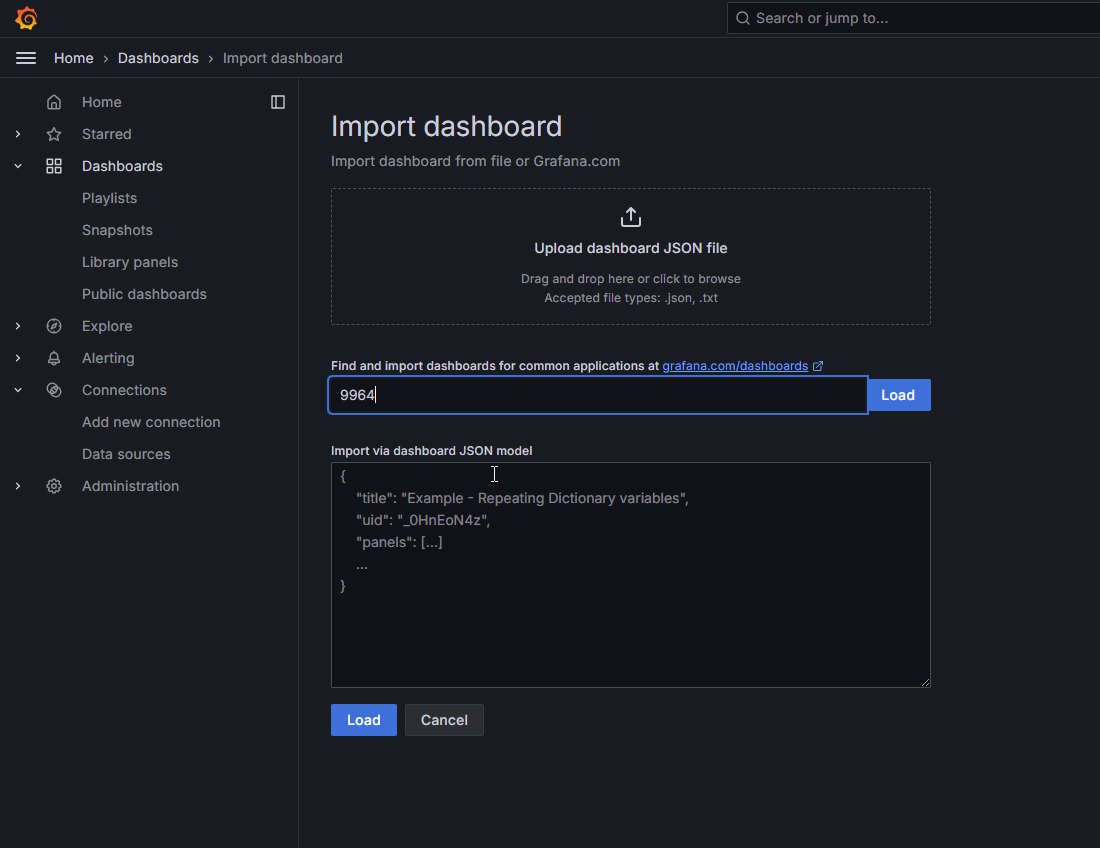
Let’s add Dashboard for a better view in Grafana
Click On Dashboard → + symbol → Import Dashboard
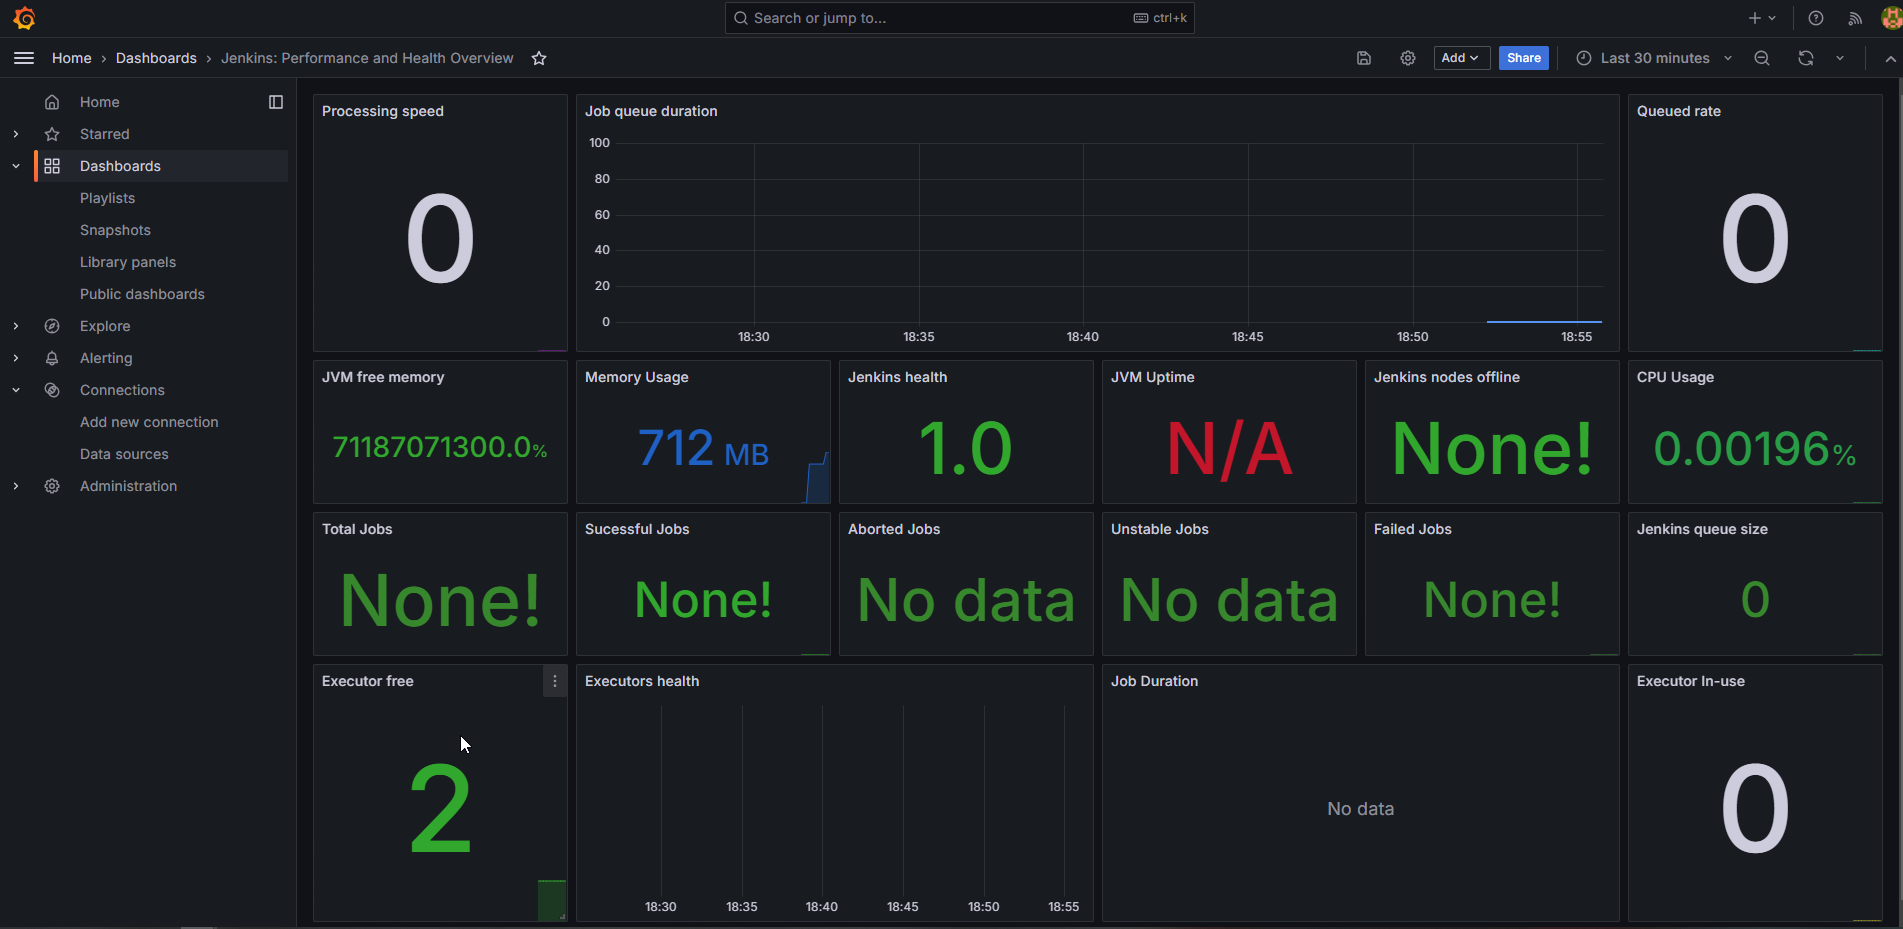
Use Id 9964 and click on load. Select the data source and click on Import. Now you will see the Detailed overview of Jenkins.
Integrate Email extension in Jenkins:
Go to your Gmail and click on your profile
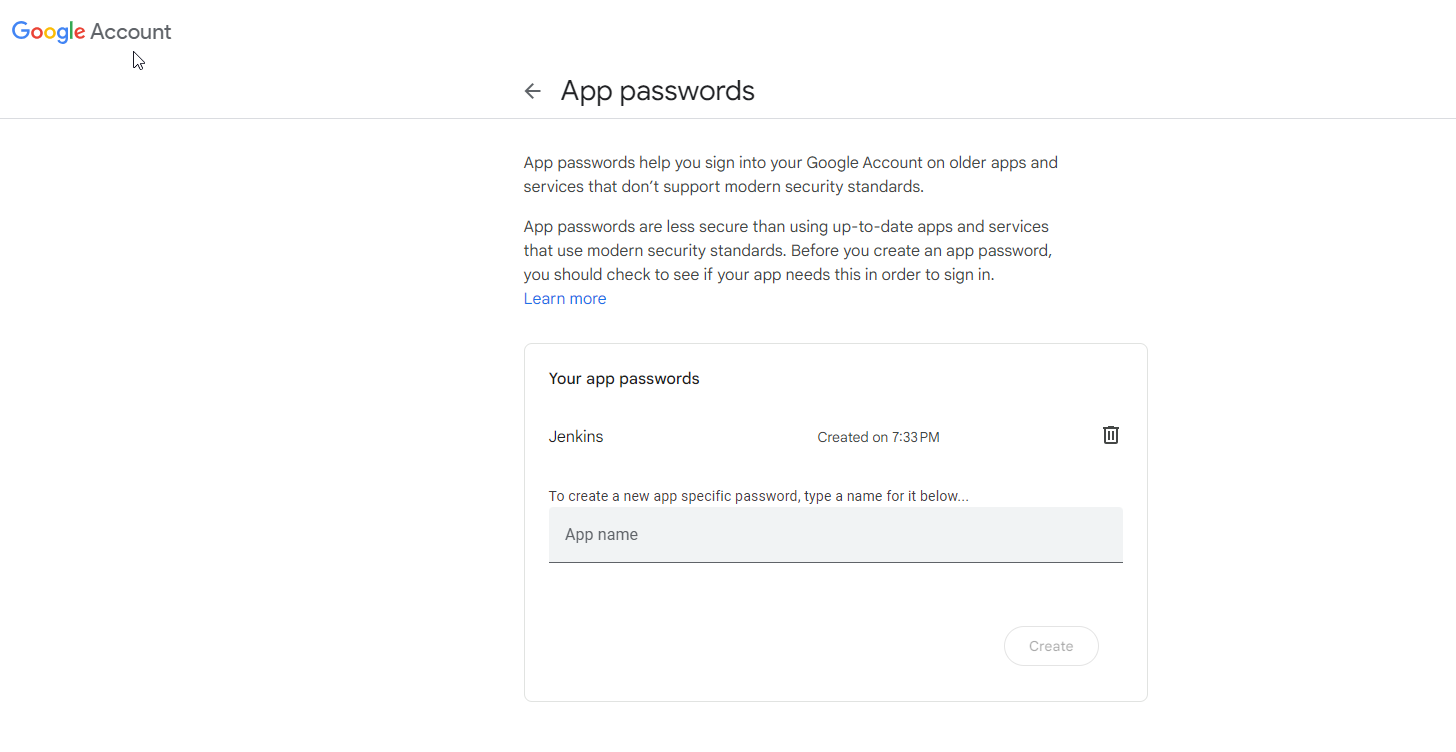
Then click on Manage Your Google Account → click on the security tab on the left side panel you will get this page(provide mail password). 2-step verification should be enabled.
Search for the app in the search bar you will get app passwords like the below image. Click on other and provide your name and click on Generate and copy the password.
Once the plugin is installed in Jenkins, click on manage Jenkins → configure system there under the E-mail Notification section configure the details as shown in the below image.
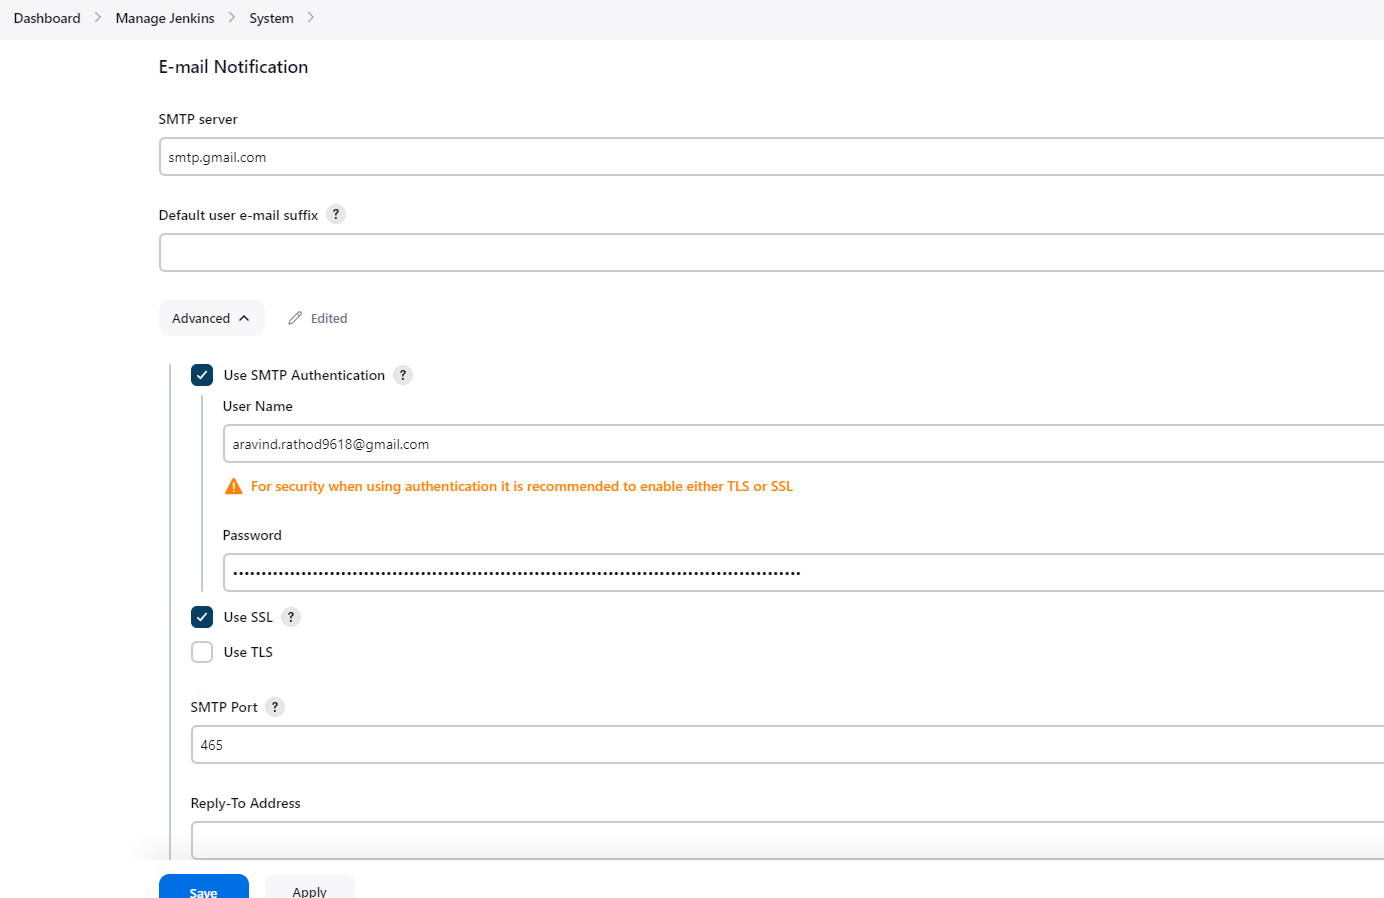
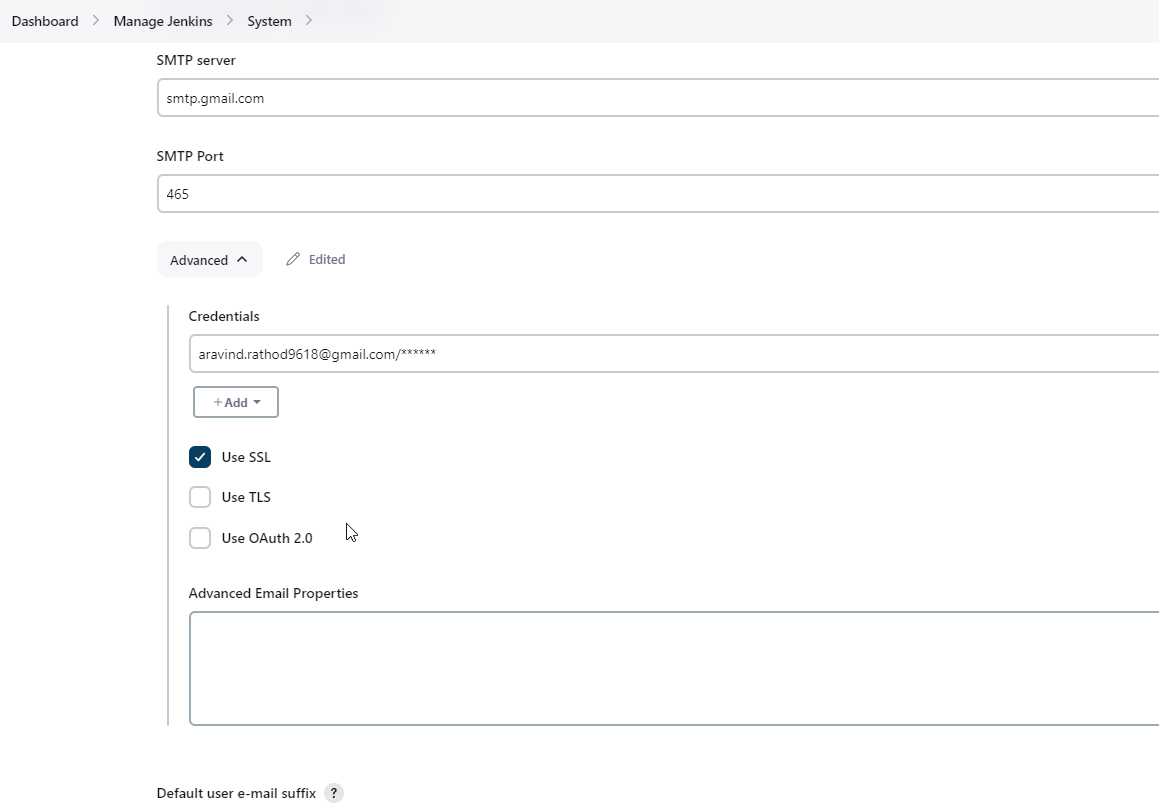
Click on Apply and save.
Click on Manage Jenkins → credentials and add your mail username and generated password.
This is to just verify the mail configuration
Now under the Extended E-mail Notification section configure the details as shown in the below images.

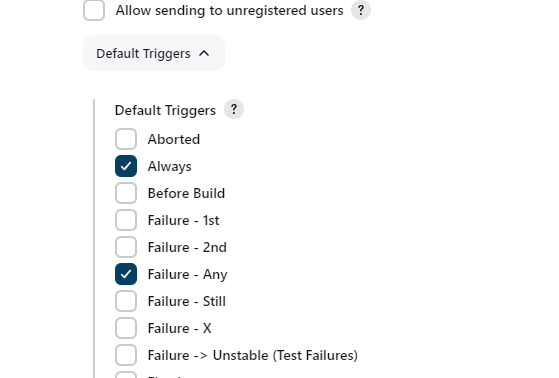
Click on Apply and save.
Step 7 — Configure Sonar Server in Manage Jenkins
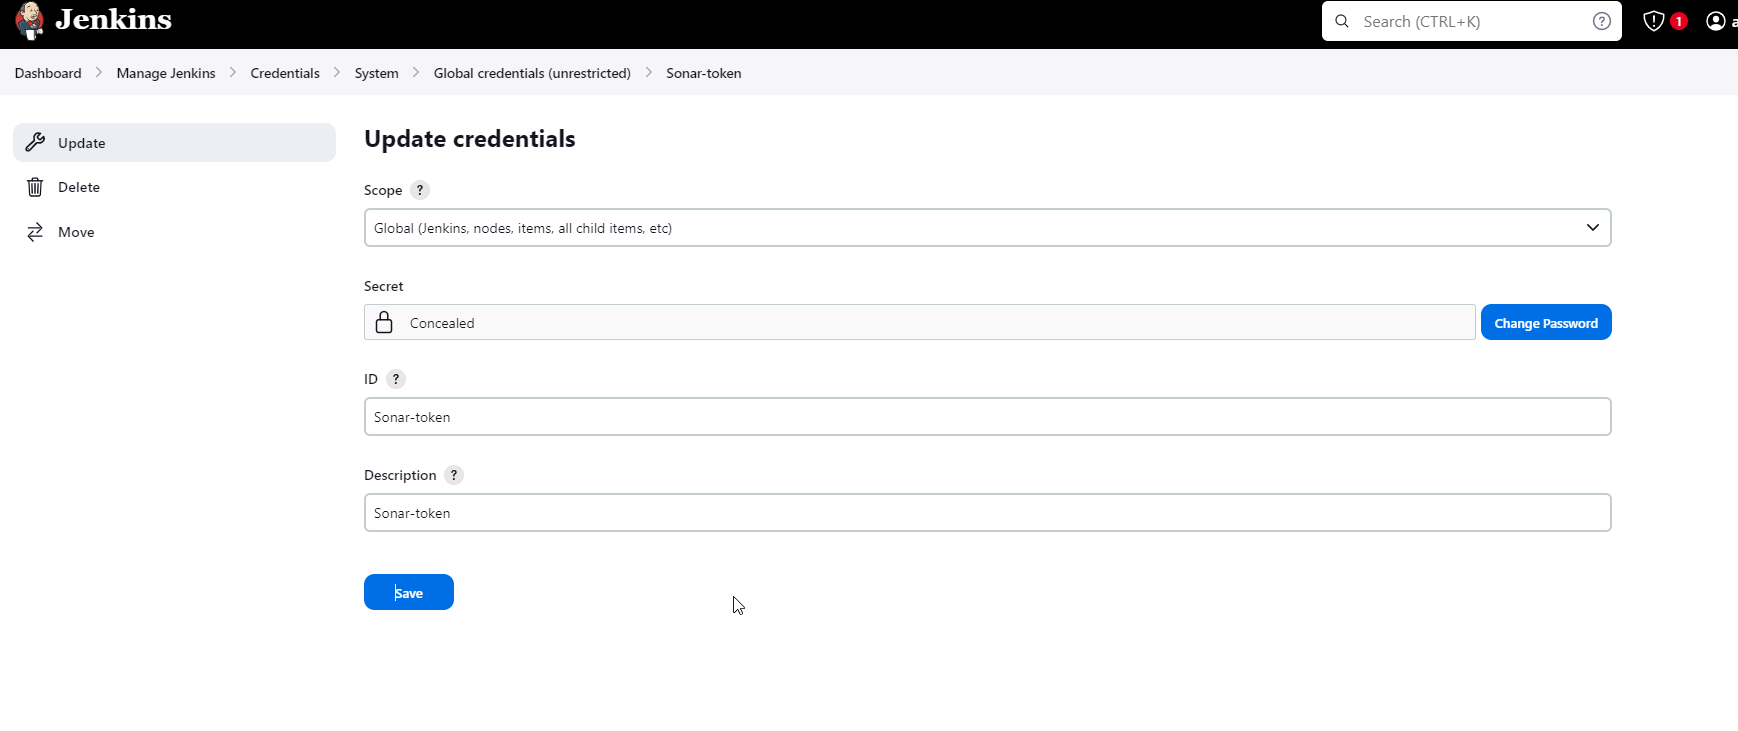
Grab the Public IP Address of your EC2 Instance, Sonarqube works on Port 9000, so <Public IP>:9000. Goto your Sonarqube Server. Click on Administration → Security → Users → Click on Tokens and Update Token → Give it a name → and click on Generate Token.
copy Token
Goto Jenkins Dashboard → Manage Jenkins → Credentials → Add Secret Text. It should look like this.
Now, go to Dashboard → Manage Jenkins → System and Add like the below image.
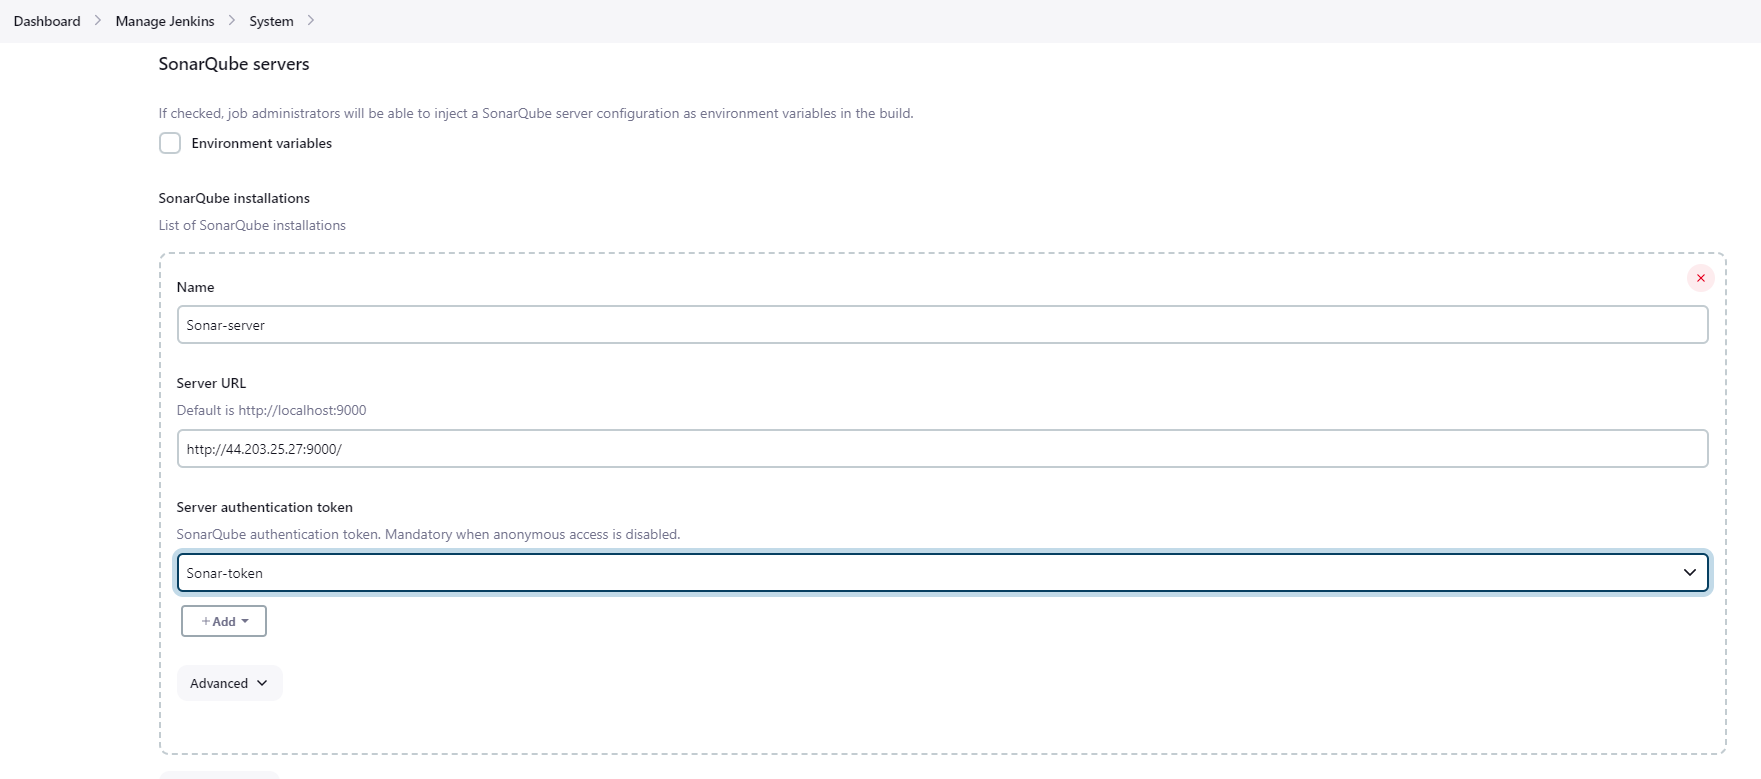
Click on Apply and Save
The Configure System option is used in Jenkins to configure different server
Global Tool Configuration is used to configure different tools that we install using Plugins
We will install a sonar scanner in the tools.
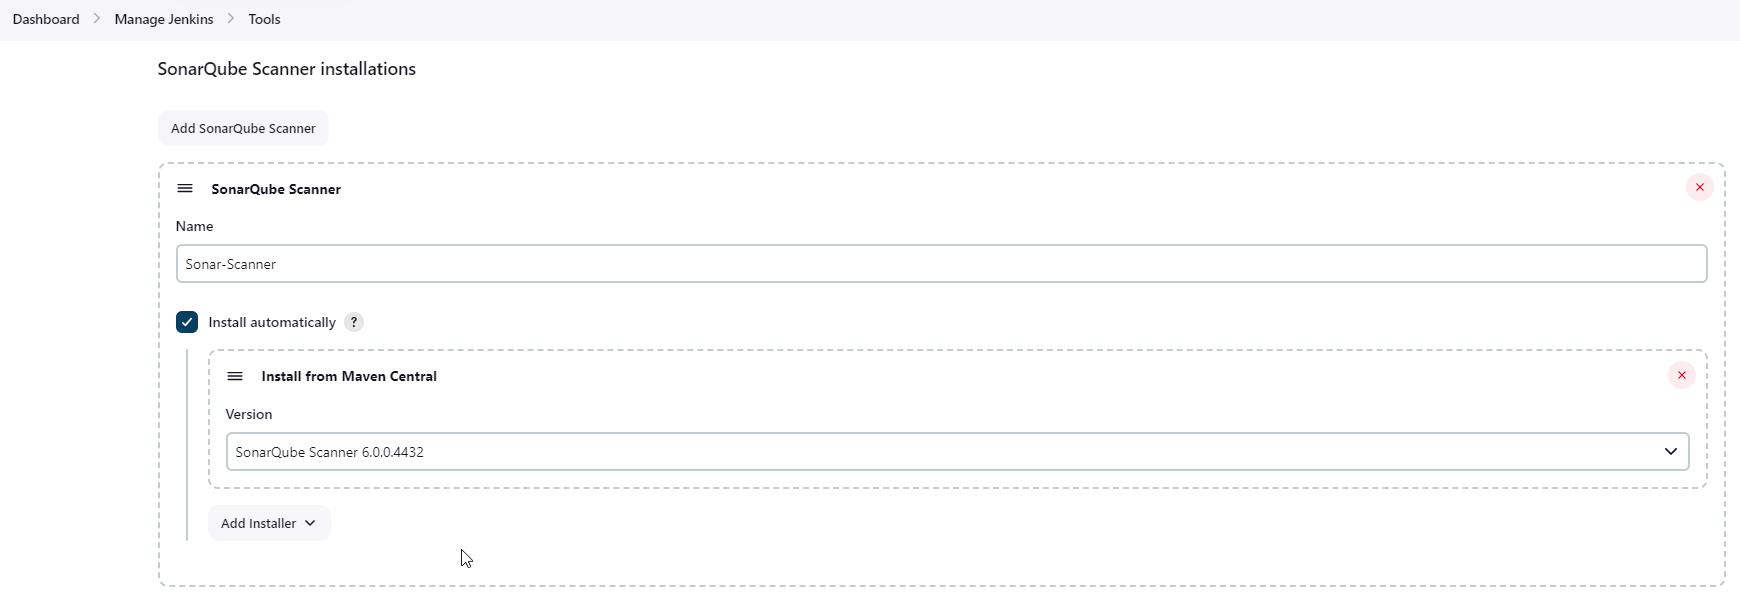
In the Sonarqube Dashboard add a quality gate also
Administration → Configuration →Webhooks
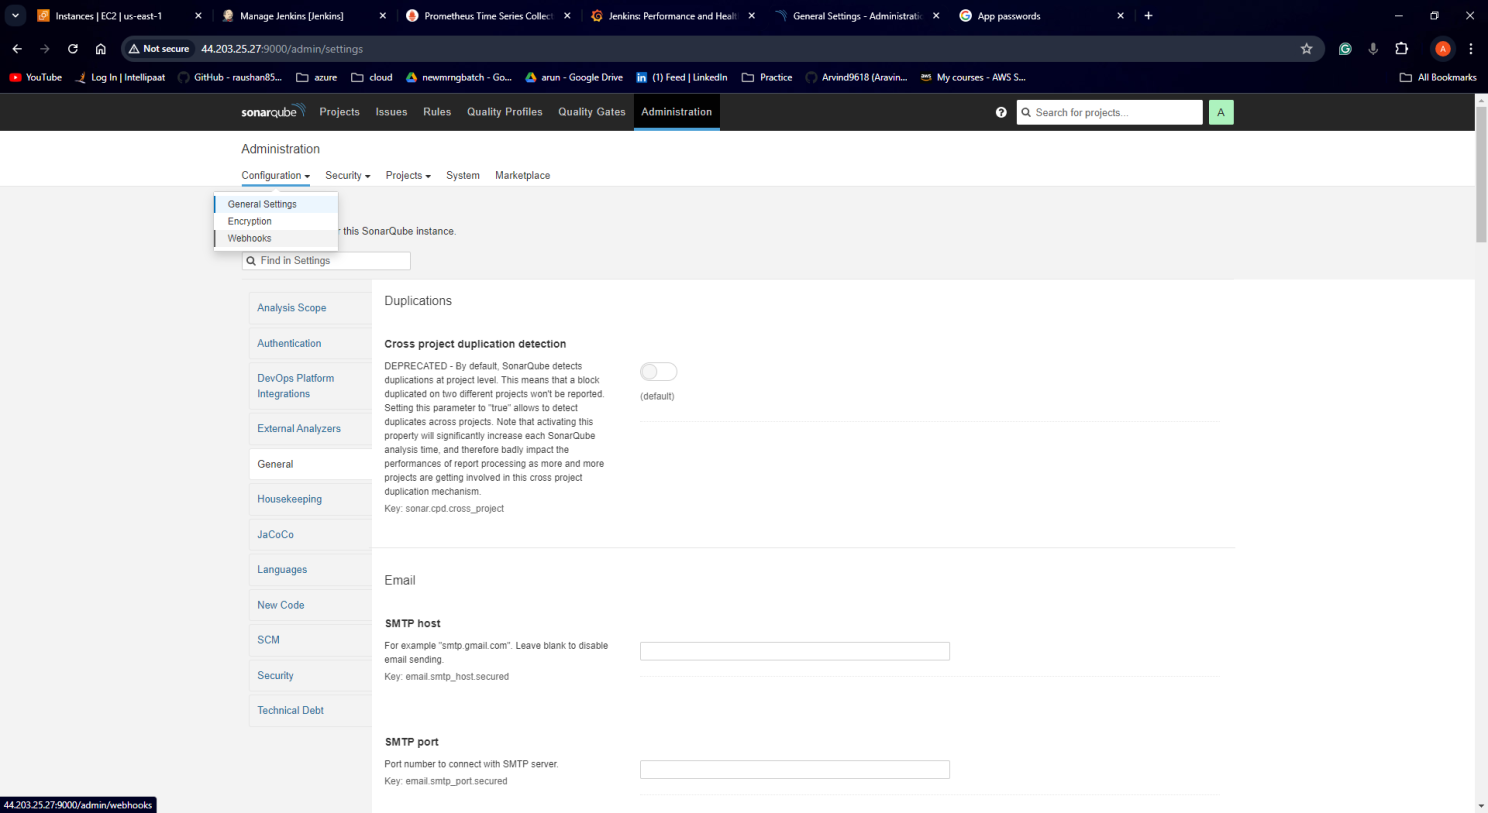
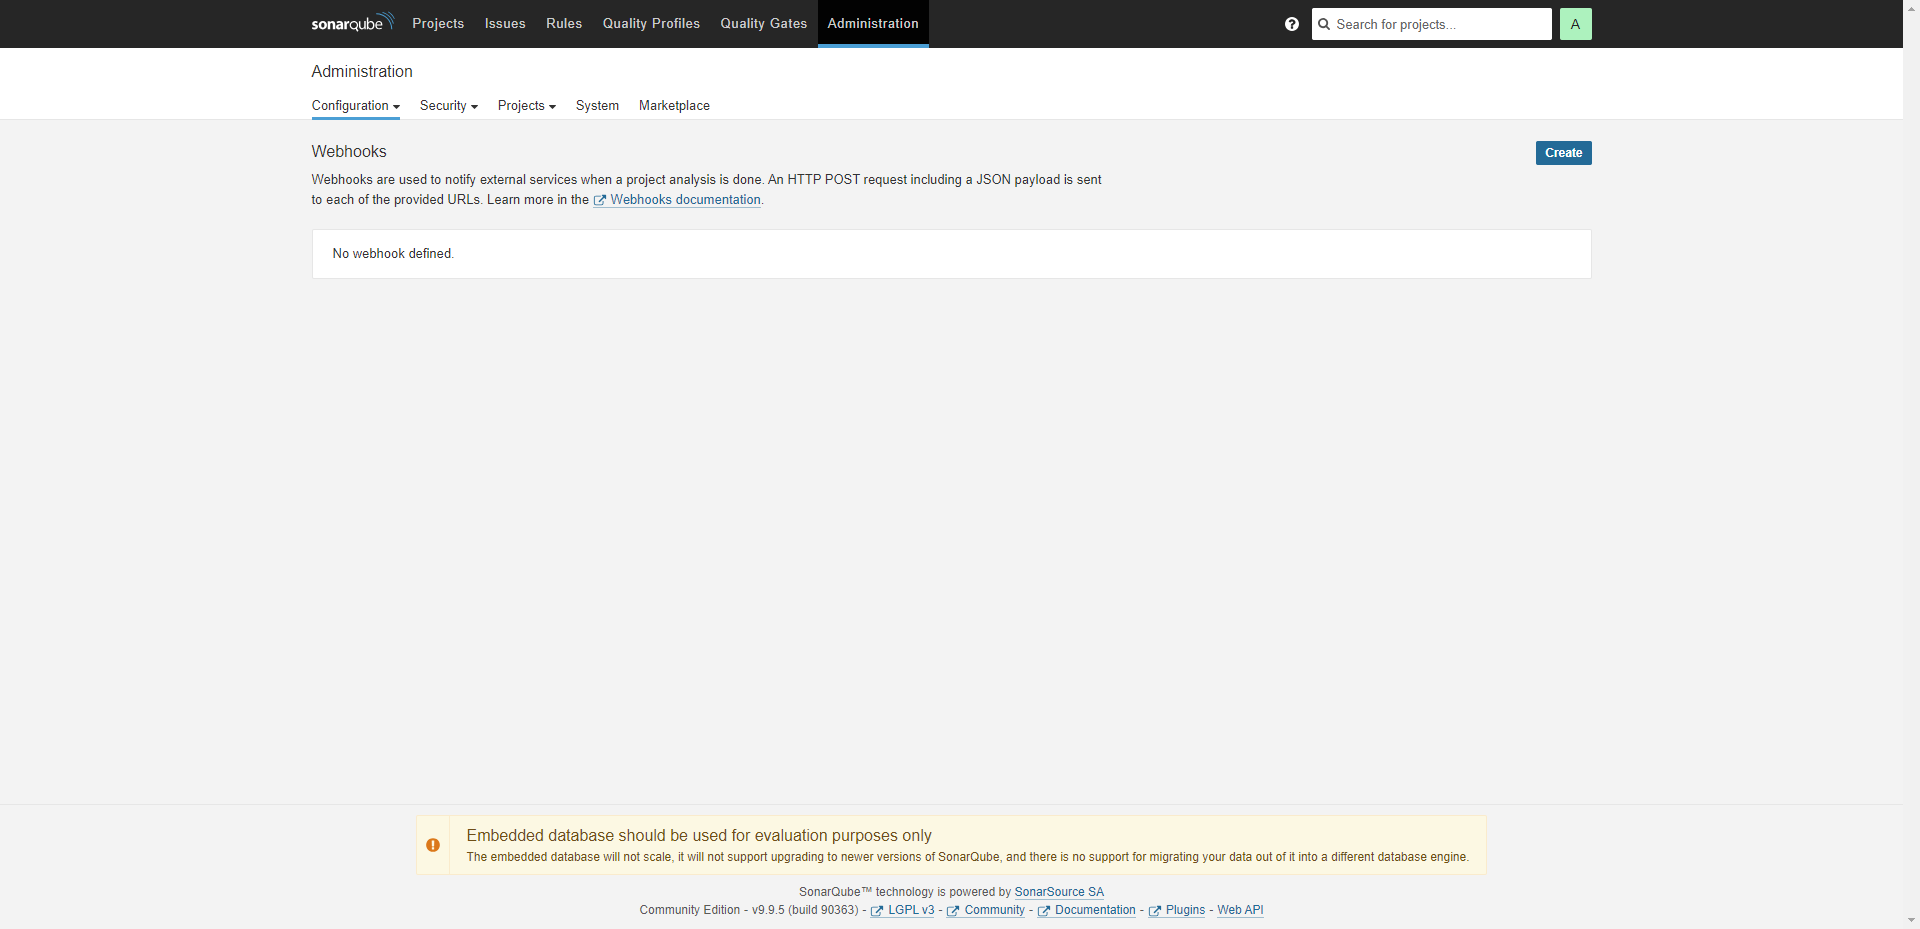
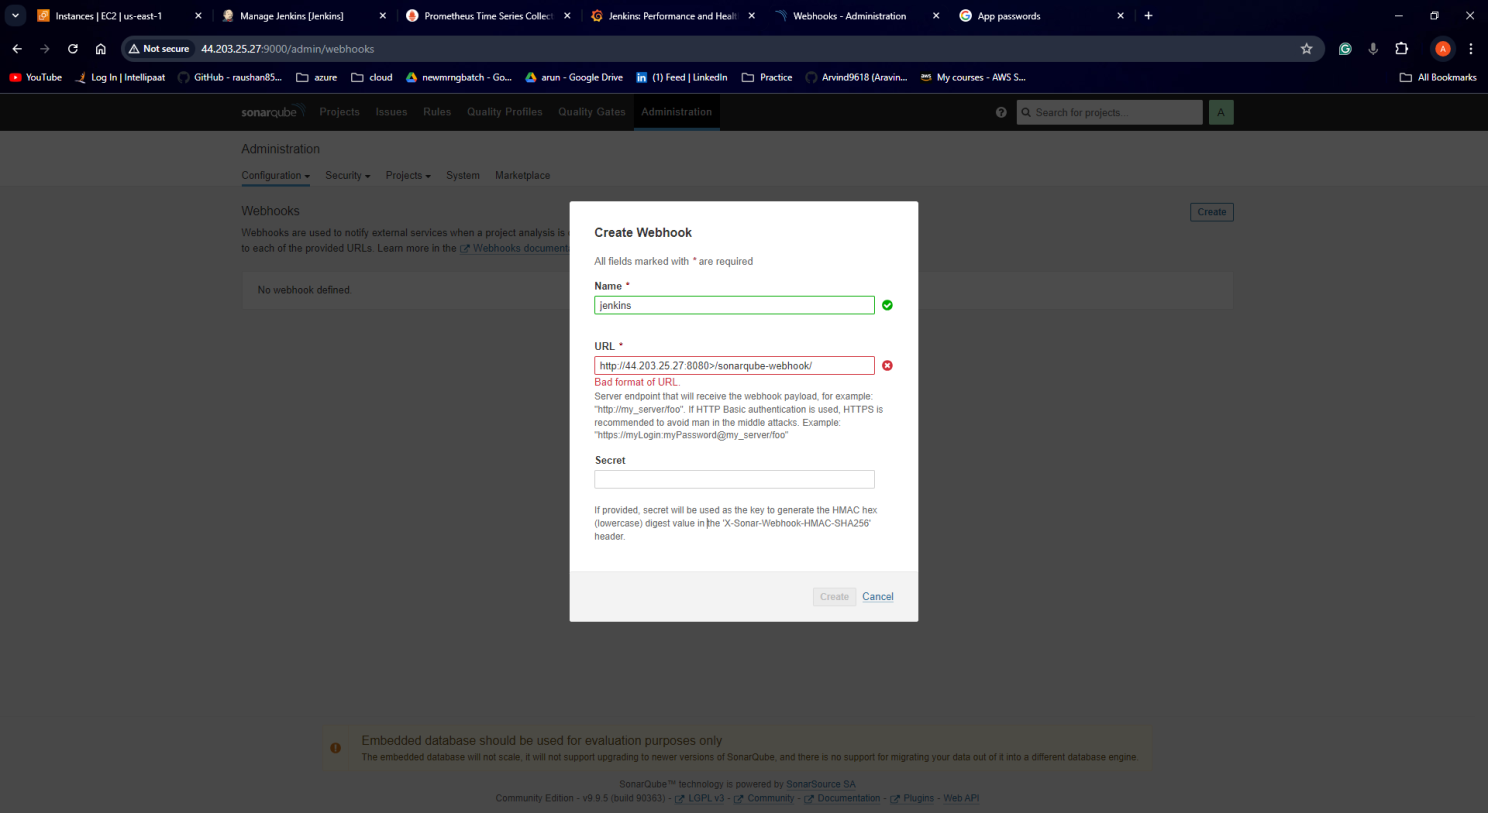
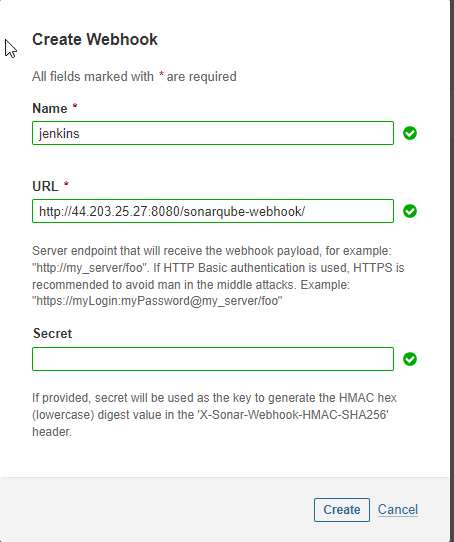
<http://ec-public-ip:8080>/sonarqube-webhook/Let’s configure OWASP Dependency Check Plugins:
Goto Dashboard → Manage Jenkins → Tools →
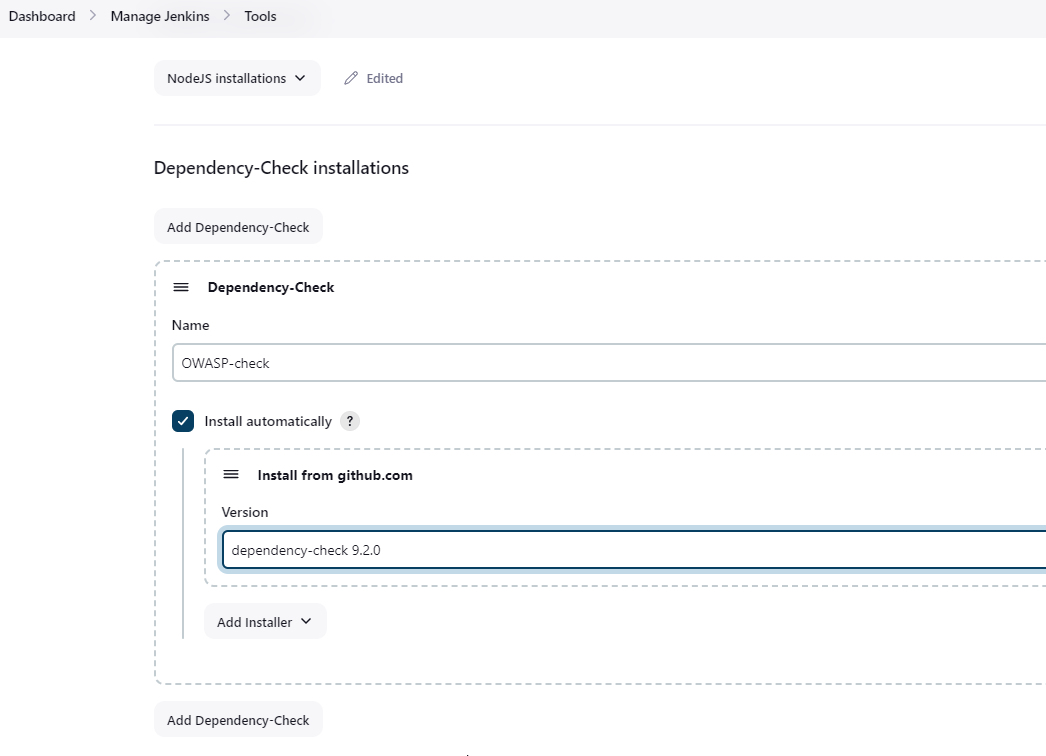
Click on Apply and Save here.
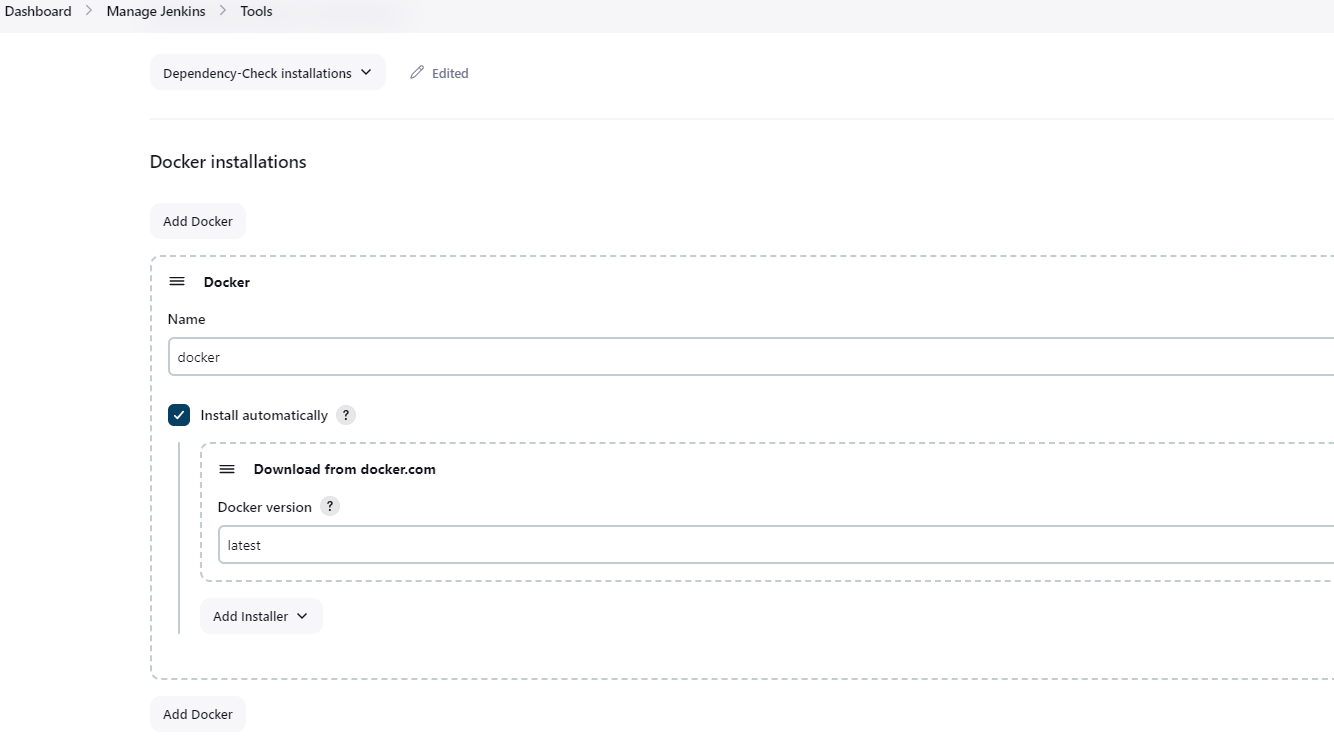
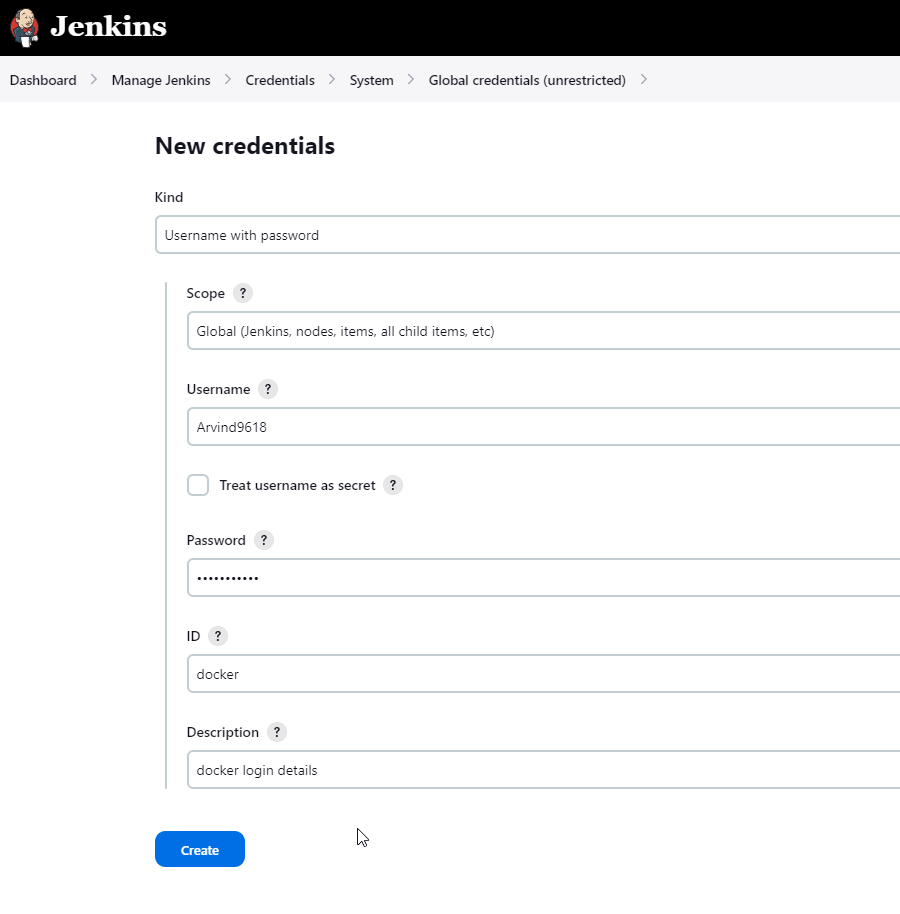
Let’s configure Docker plugin.
Now, goto Dashboard → Manage Jenkins → Tools →
Add DockerHub Username and Password under Global Credentials
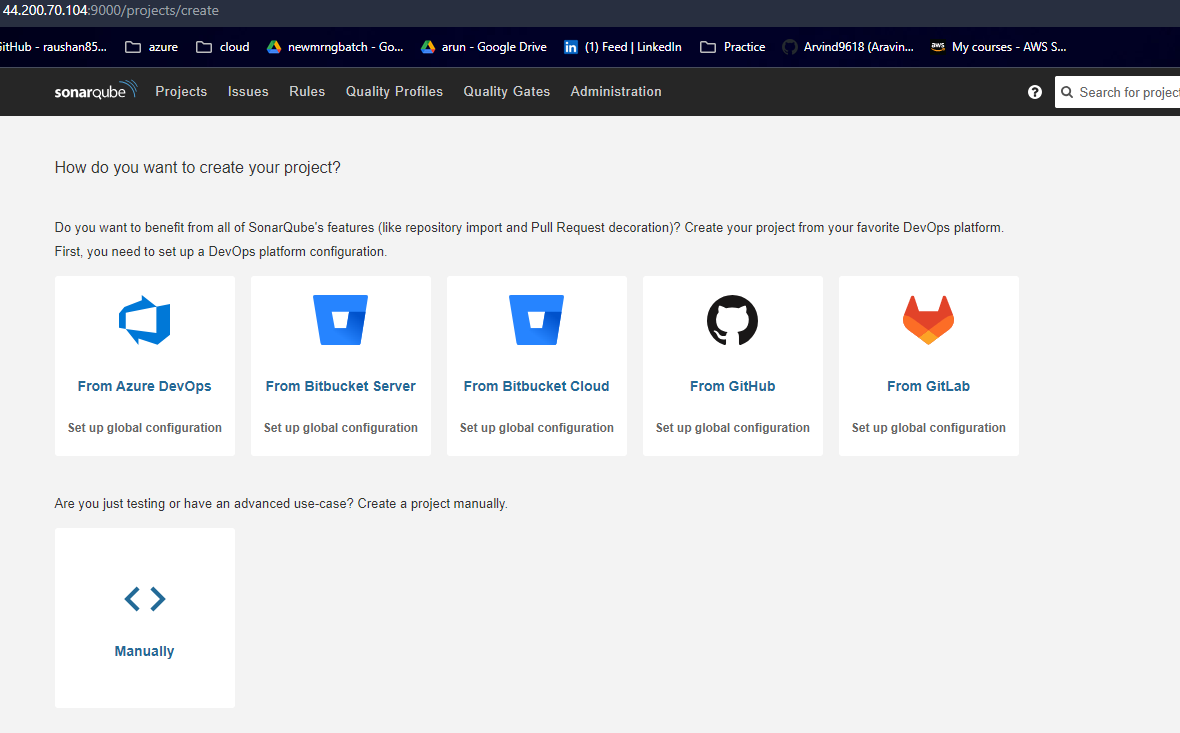
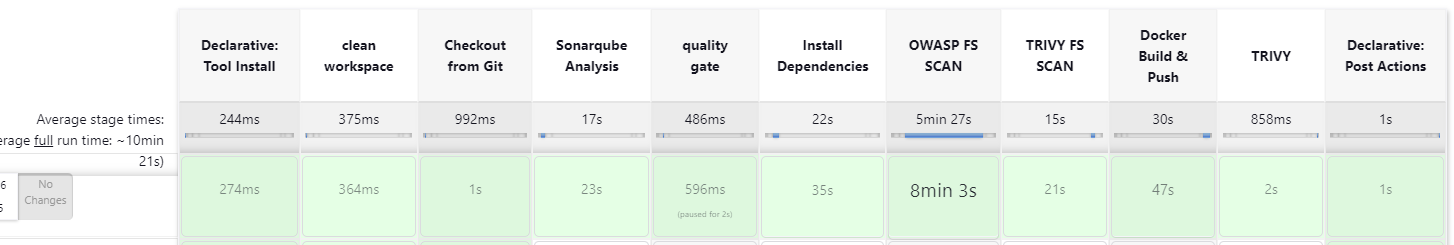
Step 8: Create a Job
create a job with Name, select pipeline, and click on ok.
add the following script and run the pipeline.
pipeline{
agent any
tools{
jdk 'jdk17'
nodejs 'node16'
}
environment {
SCANNER_HOME=tool 'sonar-scanner'
}
stages {
stage('clean workspace'){
steps{
cleanWs()
}
}
stage('Checkout from Git'){
steps{
git branch: 'main', url: 'https://github.com/Arvind9618/Netflix-clone.git'
}
}
stage("Sonarqube Analysis "){
steps{
withSonarQubeEnv('sonar-server') {
sh ''' $SCANNER_HOME/bin/sonar-scanner -Dsonar.projectName=Netflix \
-Dsonar.projectKey=Netflix '''
}
}
}
stage("quality gate"){
steps {
script {
waitForQualityGate abortPipeline: false, credentialsId: 'Sonar-token'
}
}
}
stage('Install Dependencies') {
steps {
sh "npm install"
}
}
stage('OWASP FS SCAN') {
steps {
dependencyCheck additionalArguments: '--scan ./ --disableYarnAudit --disableNodeAudit', odcInstallation: 'OWASP-check'
dependencyCheckPublisher pattern: '**/dependency-check-report.xml'
}
}
stage('TRIVY FS SCAN') {
steps {
sh "trivy fs . > trivyfs.txt"
}
}
stage("Docker Build & Push"){
steps{
script{
withDockerRegistry(credentialsId: 'docker', toolName: 'docker'){
sh "docker build --build-arg TMDB_V3_API_KEY=8ea83e5a5befd981b3303ef7646b1f02 -t netflix ."
sh "docker tag netflix aravind/netflix:latest "
sh "docker push aravind/netflix:latest "
}
}
}
}
stage('Deploy to container'){
steps{
sh 'docker run -d --name netflix -p 8081:80 arvind9618/netflix:latest'
}
}
stage("TRIVY"){
steps{
sh "trivy image aravind/netflix:latest > trivyimage.txt"
}
}
}
post {
always {
emailext attachLog: true,
subject: "'${currentBuild.result}'",
body: "Project: ${env.JOB_NAME}<br/>" +
"Build Number: ${env.BUILD_NUMBER}<br/>" +
"URL: ${env.BUILD_URL}<br/>",
to: 'aravind.rathod9618@gmail.com',
attachmentsPattern: 'trivyfs.txt,trivyimage.txt'
}
}
}
You will get the netflix output if you run your ec2 public ip with 8081 port number.
Step 9 — Kuberenetes Setup
Take-Two Ubuntu 20.04 instances one for k8s master and the other one for worker.
Install Kubectl on Jenkins machine also.
Kubectl is to be installed on Jenkins also
sudo vi kube.sh
sudo apt update
sudo apt install curl -y
curl -LO https://dl.k8s.io/release/$(curl -L -s https://dl.k8s.io/release/stable.txt)/bin/linux/amd64/kubectl
sudo install -o root -g root -m 0755 kubectl /usr/local/bin/kubectl
kubectl version --clientsudo chmod +x kube.sh ./kube.sh
Master Node
sudo hostnamectl set-hostname K8s-MasterWorker Node
sudo hostnamectl set-hostname K8s-WorkerBoth Master and Worker Nodes
sudo apt-get update
sudo apt-get install -y docker.io
sudo usermod –aG docker Ubuntu
newgrp docker
sudo chmod 777 /var/run/docker.sock
sudo curl -s https://packages.cloud.google.com/apt/doc/apt-key.gpg | sudo apt-key add -
sudo tee /etc/apt/sources.list.d/kubernetes.list <<EOF
deb https://apt.kubernetes.io/ kubernetes-xenial main
EOF
sudo apt-get update
sudo apt-get install -y kubelet kubeadm kubectl
sudo snap install kube-apiserverMaster Node
sudo kubeadm init --pod-network-cidr=10.244.0.0/16
# in case your in root exit from it and run below commands
mkdir -p $HOME/.kube
sudo cp -i /etc/kubernetes/admin.conf $HOME/.kube/config
sudo chown $(id -u):$(id -g) $HOME/.kube/config
kubectl apply -f https://raw.githubusercontent.com/coreos/flannel/master/Documentation/kube-flannel.ymlWorker Node
sudo kubeadm join <master-node-ip>:<master-node-port> --token <token> --discovery-token-ca-cert-hash <hash>Copy the config file to Jenkins master or the local file manager and save it.
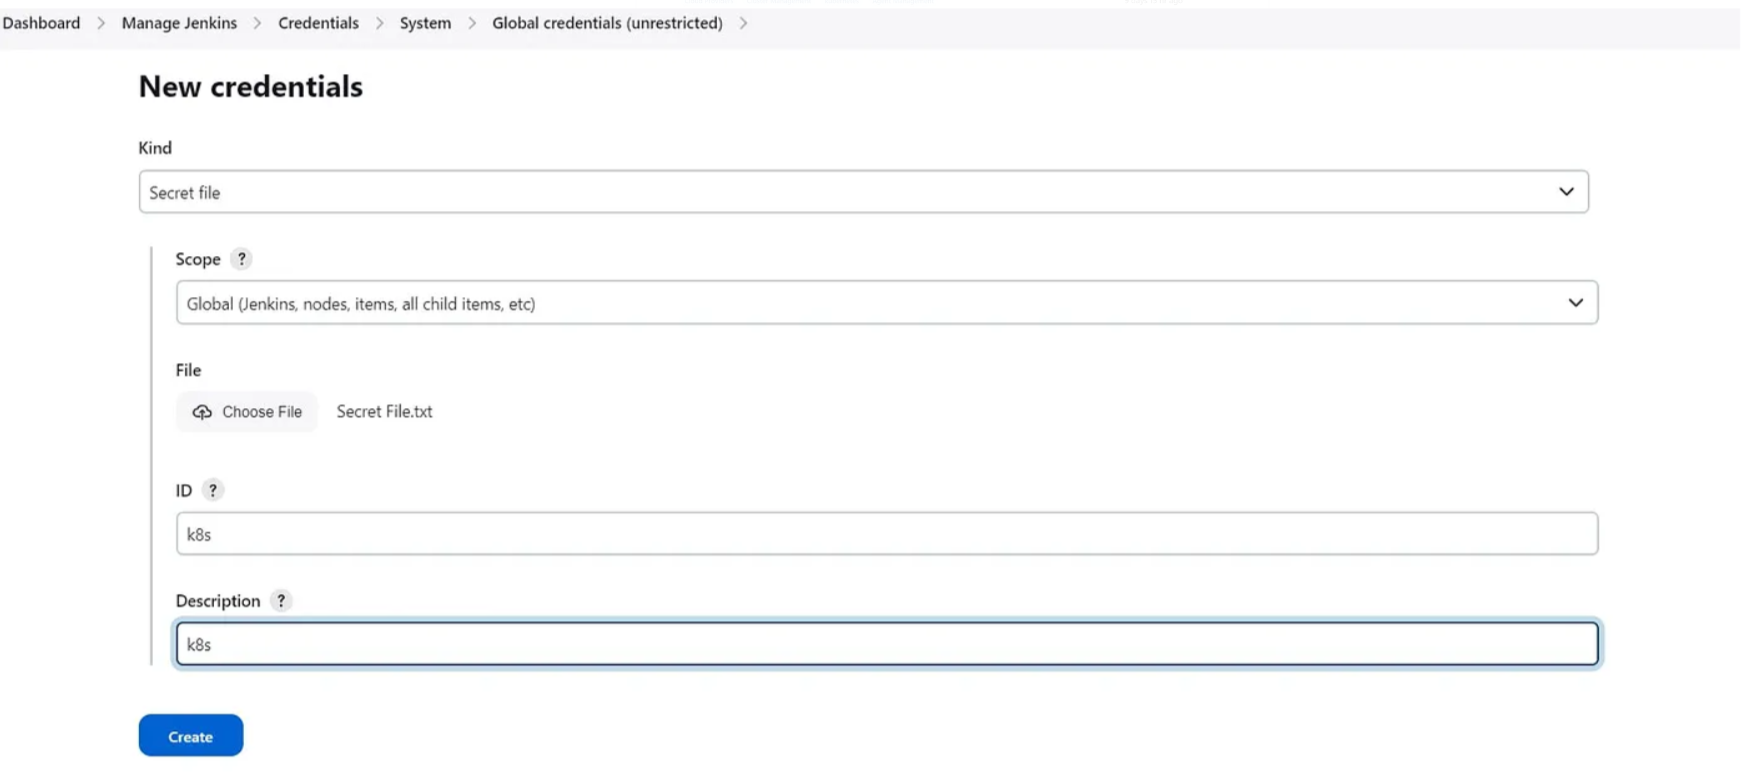
copy it and save it in documents or another folder save it as secret-file.txt
Note: create a secret-file.txt in your file explorer save the config in it and use this at the kubernetes credential section.
goto manage Jenkins → manage credentials → Click on Jenkins global → add credentials
Install Node_exporter on both the master and worker
Let’s add Node_exporter on Master and Worker to monitor the metrics
First, let’s create a system user for Node Exporter by running the following command:
sudo useradd \
--system \
--no-create-home \
--shell /bin/false node_exporterYou can download Node Exporter from the same page.
Use the wget command to download the binary.
wget https://github.com/prometheus/node_exporter/releases/download/v1.6.1/node_exporter-1.6.1.linux-amd64.tar.gzExtract the node exporter from the archive.
tar -xvf node_exporter-1.6.1.linux-amd64.tar.gzMove binary to the /usr/local/bin.
sudo mv \
node_exporter-1.6.1.linux-amd64/node_exporter \
/usr/local/bin/Verify that you can run the binary.
node_exporter --versionNext, create a similar systemd unit file.
sudo vim /etc/systemd/system/node_exporter.servicenode_exporter.service
[Unit]
Description=Node Exporter
Wants=network-online.target
After=network-online.target

StartLimitIntervalSec=500
StartLimitBurst=5

[Service]
User=node_exporter
Group=node_exporter
Type=simple
Restart=on-failure
RestartSec=5s
ExecStart=/usr/local/bin/node_exporter \
    --collector.logind

[Install]
WantedBy=multi-user.target
To automatically start the Node Exporter after reboot, enable the service.
sudo systemctl enable node_exporterThen start the Node Exporter.
sudo systemctl start node_exporterCheck the status of Node Exporter with the following command:
sudo systemctl status node_exporterIf you have any issues, check logs with journalctl
journalctl -u node_exporter -f --no-pagerTo create a static target, you need to add job_name with static_configs. Go to Prometheus server
sudo vim /etc/prometheus/prometheus.ymlprometheus.yml
 - job_name: node_export_masterk8s
    static_configs:
      - targets: ["<master-ip>:9100"]

  - job_name: node_export_workerk8s
    static_configs:
      - targets: ["<worker-ip>:9100"]
By default, Node Exporter will be exposed on port 9100.
Since we enabled lifecycle management via API calls, we can reload the Prometheus config without restarting the service and causing downtime.
Before, restarting check if the config is valid.
promtool check config /etc/prometheus/prometheus.ymlThen, you can use a POST request to reload the config.
curl -X POST http://localhost:9090/-/reloadCheck the targets section
http://<ip>:9090/targetsfinal step to deploy on the Kubernetes cluster
pipeline{
    agent any
    tools{
        jdk 'jdk17'
        nodejs 'node16'
    }
    environment {
        SCANNER_HOME=tool 'sonar-scanner'
    }
    stages {
        stage('clean workspace'){
            steps{
                cleanWs()
            }
        }
        stage('Checkout from Git'){
            steps{
                git branch: 'main', url: 'https://github.com/Arvind9618/Netflix-clone.git'
            }
        }
        stage("Sonarqube Analysis "){
            steps{
                withSonarQubeEnv('sonar-server') {
                    sh ''' $SCANNER_HOME/bin/sonar-scanner -Dsonar.projectName=Netflix \
                    -Dsonar.projectKey=Netflix '''
                }
            }
        }
        stage("quality gate"){
           steps {
                script {
                    waitForQualityGate abortPipeline: false, credentialsId: 'Sonar-token'
                }
            }
        }
        stage('Install Dependencies') {
            steps {
                sh "npm install"
            }
        }
		stage('OWASP FS SCAN') {
            steps {
                dependencyCheck additionalArguments: '--scan ./ --disableYarnAudit --disableNodeAudit', odcInstallation: 'OWASP-check'
                dependencyCheckPublisher pattern: '**/dependency-check-report.xml'
            }
        }
        stage('TRIVY FS SCAN') {
            steps {
                sh "trivy fs . > trivyfs.txt"
            }
        }
		stage("Docker Build & Push"){
            steps{
                script{
                   withDockerRegistry(credentialsId: 'docker', toolName: 'docker'){
                       sh "docker build --build-arg TMDB_V3_API_KEY=8ea83e5a5befd981b3303ef7646b1f02 -t netflix ."
                       sh "docker tag netflix aravind/netflix:latest "
                       sh "docker push aravind/netflix:latest "
                    }
                }
            }
        }
		stage('Deploy to container'){
            steps{
                sh 'docker run -d --name netflix -p 8081:80 arvind9618/netflix:latest'
            }
        }
		stage('Deploy to kubernets'){
            steps{
                script{
                    dir('Kubernetes') {
                        withKubeConfig(caCertificate: '', clusterName: '', contextName: '', credentialsId: 'k8s', namespace: '', restrictKubeConfigAccess: false, serverUrl: '') {
                                sh 'kubectl apply -f deployment.yml'
                                sh 'kubectl apply -f service.yml'
                        }
                    }
                }
            }
        }
        stage("TRIVY"){
            steps{
                sh "trivy image aravind/netflix:latest > trivyimage.txt"
            }
        }
    }
    post {
     always {
        emailext attachLog: true,
            subject: "'${currentBuild.result}'",
            body: "Project: ${env.JOB_NAME}<br/>" +
                "Build Number: ${env.BUILD_NUMBER}<br/>" +
                "URL: ${env.BUILD_URL}<br/>",
            to: 'aravind.rathod9618@gmail.com',
            attachmentsPattern: 'trivyfs.txt,trivyimage.txt'
        }
    }
}
Step 10: Access from a web browser
<public-ip-of-slave:service port>
to get service port, In the Kubernetes cluster(master) give this command
kubectl get all
kubectl get svc #use anyone
This setup demonstrates a modern DevOps approach with continuous integration, delivery, and deployment, along with security scanning and containerized application management.